Supported by Dr. Osamu Ogasawara and  . . |
|
Last data update: 2014.03.03 |
Dot plot: scatter plot with stacked dots similar to the stem-and-leaf plotDescriptionDisplays an one-dimensional scatter plot with stacking similar to stem-and-leaf plot or histograms. Usage
dotPlot(x, y = 0, xlim = range(x,na.rm=TRUE), xlab = NULL,
    scatter = FALSE, hmax = 1, base = TRUE, axes = TRUE, frame = FALSE,
    pch = 21, pch.size = "x", labels = NULL, hcex = 1, cex =par("cex"),
    cex.axis = par("cex.axis"),...)
Arguments
DetailsBasically function ValueThe function is called for its side effect which is to produce one-dimensional scatter plot with stacking as described, for example, in Chambers et al. (1983) It returns invisible a data frame with the actual coordinates (in users units). NoteSince the dots are stacked vertically, their alignment is subject to rounding errors. Dots may be slightly moved in either side from their actual value. Author(s)Ernesto Barrios ReferencesChambers, J. M., Cleveland, W. S., Kleiner, B. and Tukey, P. A. (1983) Graphical Methods for Data Analysis. New York: Chapman & Hall See Also
Examples
library(BHH2)
data(tab03B1)
attach(tab03B1)
stem(yield) #stem-leaf plot
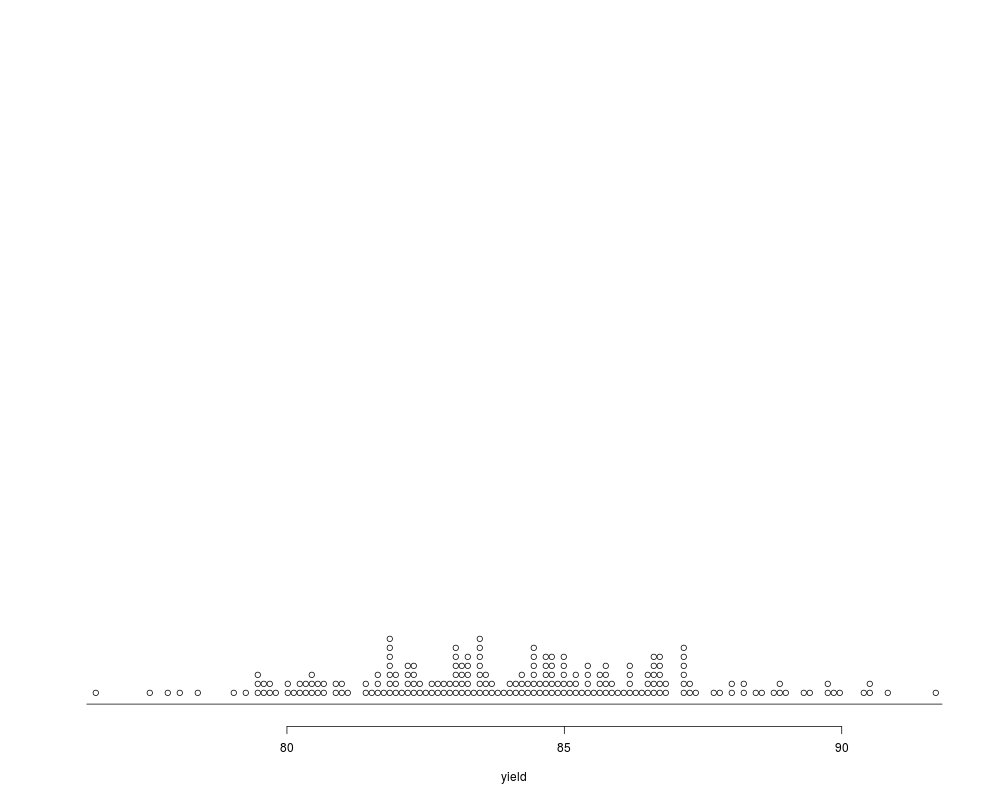
plt <- dotPlot(yield) # equivalent dotPlot
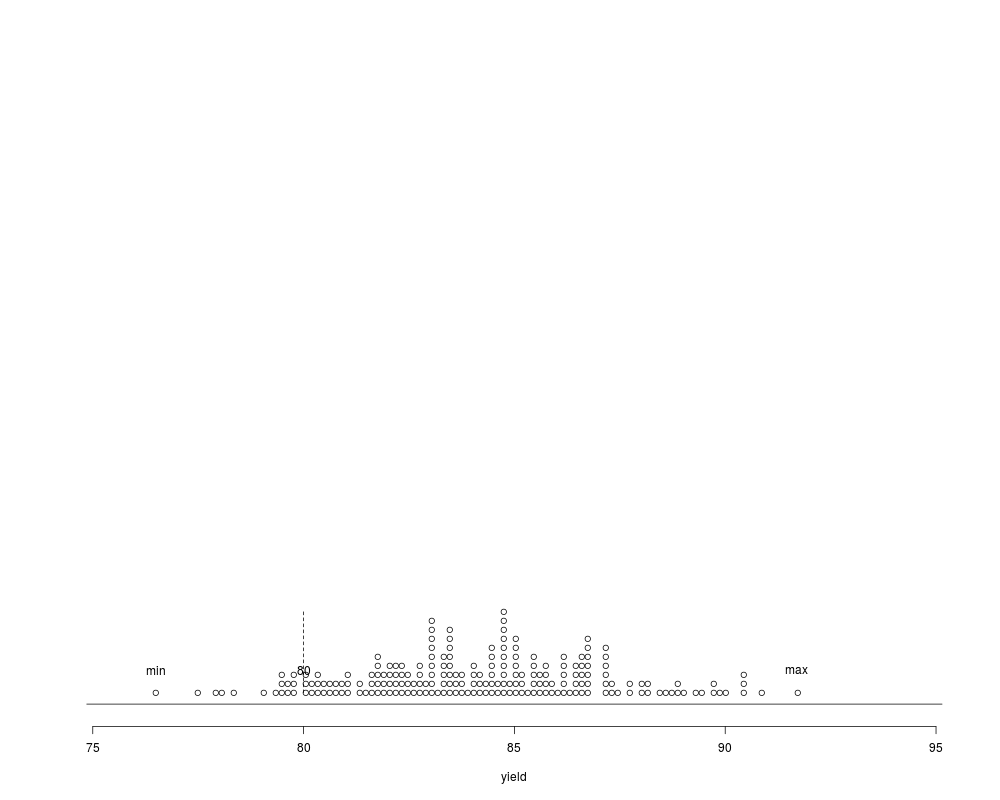
# same dot plot with max and min observations labelled
plt <- dotPlot(yield,xlim=c(75,95),xlab="yield",pch.size="x",hcex=1)
text(c(min(yield),max(yield),80),rep(0.05,3),c("min","max",80))
segments(80,min(plt$y),80,max(plt$y),lty=2)
detach()
Results
R version 3.3.1 (2016-06-21) -- "Bug in Your Hair"
Copyright (C) 2016 The R Foundation for Statistical Computing
Platform: x86_64-pc-linux-gnu (64-bit)

R is free software and comes with ABSOLUTELY NO WARRANTY.
You are welcome to redistribute it under certain conditions.
Type 'license()' or 'licence()' for distribution details.

R is a collaborative project with many contributors.
Type 'contributors()' for more information and
'citation()' on how to cite R or R packages in publications.

Type 'demo()' for some demos, 'help()' for on-line help, or
'help.start()' for an HTML browser interface to help.
Type 'q()' to quit R.

> library(BHH2)
> png(filename="/home/ddbj/snapshot/RGM3/R_CC/result/BHH2/dotPlot.Rd_%03d_medium.png", width=480, height=480)
> ### Name: dotPlot
> ### Title: Dot plot: scatter plot with stacked dots similar to the
> ###   stem-and-leaf plot
> ### Aliases: dotPlot
> ### Keywords: hplot
>
> ### ** Examples
>
> library(BHH2)
> data(tab03B1)
> attach(tab03B1)
> stem(yield) #stem-leaf plot

  The decimal point is at the |

  76 | 5
  77 | 59
  78 | 14
  79 | 0355566778
  80 | 0012233455667799
  81 | 00144566678888999
  82 | 00012222333344566778899
  83 | 000000111233333455555556667789
  84 | 00112223344445566777778888899
  85 | 0000011222344445666778899
  86 | 01222234555666667777788
  87 | 12222233478
  88 | 002246899
  89 | 034779
  90 | 04558
  91 | 7

> plt <- dotPlot(yield) # equivalent dotPlot
>
> # same dot plot with max and min observations labelled
> plt <- dotPlot(yield,xlim=c(75,95),xlab="yield",pch.size="x",hcex=1)
> text(c(min(yield),max(yield),80),rep(0.05,3),c("min","max",80))
> segments(80,min(plt$y),80,max(plt$y),lty=2)
> detach()
>
>
>
>
>
> dev.off()
null device
          1
>
|