Supported by Dr. Osamu Ogasawara and  . . |
|
Last data update: 2014.03.03 |
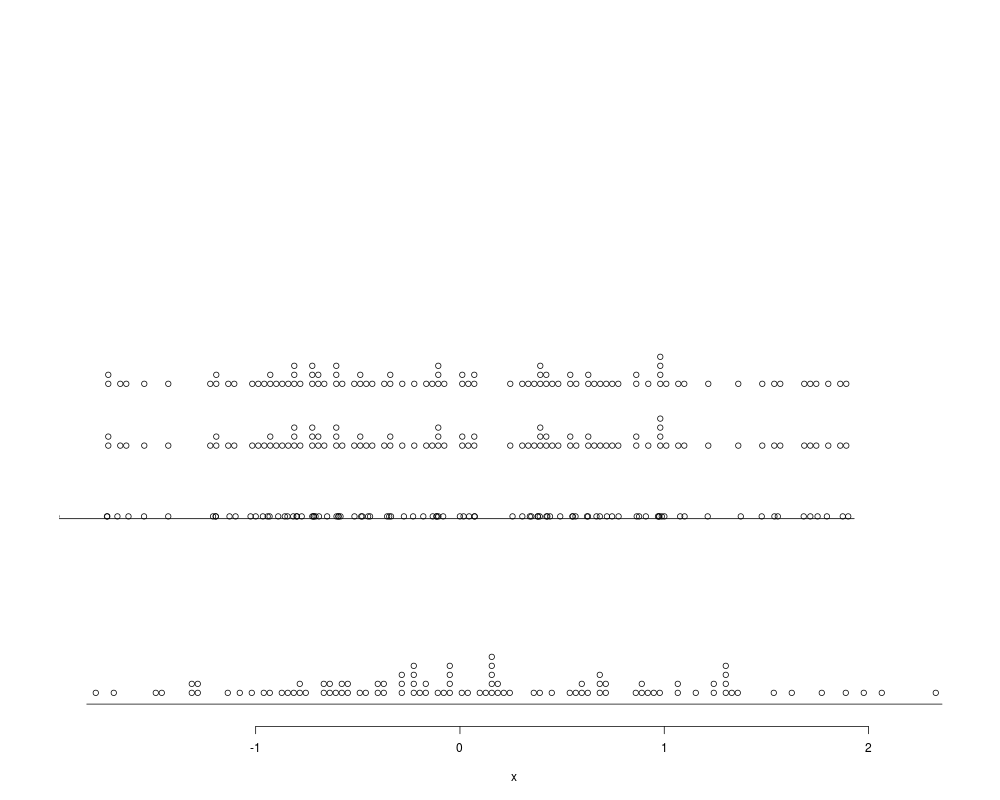
Dots displayDescriptionThe function adds to the current plot an one-dimensional scatter plot with stacking similar to a stem-leaf plot or histograms but using characters. . Usage
    dots(x = , y = 0.1, xlim = range(x,na.rm=TRUE), stacked = FALSE, hmax= 0.5,
    base = TRUE, axes = FALSE, pch = 21, pch.size = "x", labels = NULL,
    hcex = 1, cex = par("cex"), cex.axis = par("cex.axis"))
Arguments
DetailsFunction ValueInvisible data frame with columns (x,y,labels). ‘x’ and ‘y’ are the coordinates in user units of each point and ‘labels’ the corresponding character displayed. Author(s)Ernesto Barrios See Also
Exampleslibrary(BHH2) set.seed(4) # Defines the height of the plot area between c(0,1) dotPlot(rnorm(100),xlab="x") x <- rnorm(100) # plots (possibly) overlapping points at y=0.3 dots(x,y=0.3) # plots (possibly) overlapping points at y=0.4 dots(x,y=0.4,stacked=TRUE,base=FALSE) # plots (hopefully) stacked points at y=0.5 allowing the dots to as high as 0.9 dots(x,y=0.5,stacked=TRUE,base=FALSE,hmax=.9) Results
R version 3.3.1 (2016-06-21) -- "Bug in Your Hair"
Copyright (C) 2016 The R Foundation for Statistical Computing
Platform: x86_64-pc-linux-gnu (64-bit)

R is free software and comes with ABSOLUTELY NO WARRANTY.
You are welcome to redistribute it under certain conditions.
Type 'license()' or 'licence()' for distribution details.

R is a collaborative project with many contributors.
Type 'contributors()' for more information and
'citation()' on how to cite R or R packages in publications.

Type 'demo()' for some demos, 'help()' for on-line help, or
'help.start()' for an HTML browser interface to help.
Type 'q()' to quit R.

> library(BHH2)
> png(filename="/home/ddbj/snapshot/RGM3/R_CC/result/BHH2/dots.Rd_%03d_medium.png", width=480, height=480)
> ### Name: dots
> ### Title: Dots display
> ### Aliases: dots
> ### Keywords: aplot hplot
>
> ### ** Examples
>
> library(BHH2)
> set.seed(4)
> # Defines the height of the plot area between c(0,1)
> dotPlot(rnorm(100),xlab="x")
>
> x <- rnorm(100)
>
> # plots (possibly) overlapping points at y=0.3
> dots(x,y=0.3)
> # plots (possibly) overlapping points at y=0.4
> dots(x,y=0.4,stacked=TRUE,base=FALSE)
> # plots (hopefully) stacked points at y=0.5 allowing the dots to as high as 0.9
> dots(x,y=0.5,stacked=TRUE,base=FALSE,hmax=.9)
>
>
>
>
>
> dev.off()
null device
          1
>
|