Supported by Dr. Osamu Ogasawara and  . . |
|
Last data update: 2014.03.03 |
Lambda plot: traces the t and F statistics in Box-Cox transformation of the responseDescriptionTrace regression coefficients' t-values or F-ratios for different values of λ in the Box-Cox transformation. Usage
lambdaPlot(mod, lambda = seq(-1, 1, by = 0.1), stat = "F", global = TRUE,
    cex = par("cex"), ...)
Arguments
DetailsThe response is transformed as
Y=(y^λ - 1)/λ
for each value of λ ( ValueThe function returns an invisible list with components:
NoteFor each value of λ the model is refitted. Computations can be done more efficiently and will be incorporated in future versions. Author(s)Ernesto Barrios ReferencesBox, G. E. P. and C. Fung (1995) "The Importance of Data Transformation in Designed Experiments for Life Testing". Quality Engineering, Vol. 7, No. 3, pp. 625-68. Box G. E. P, Hunter, J. S. and Hunter, W. C. (2005). Statistics for Experimenters II. New York: Wiley. Examples
library(BHH2)
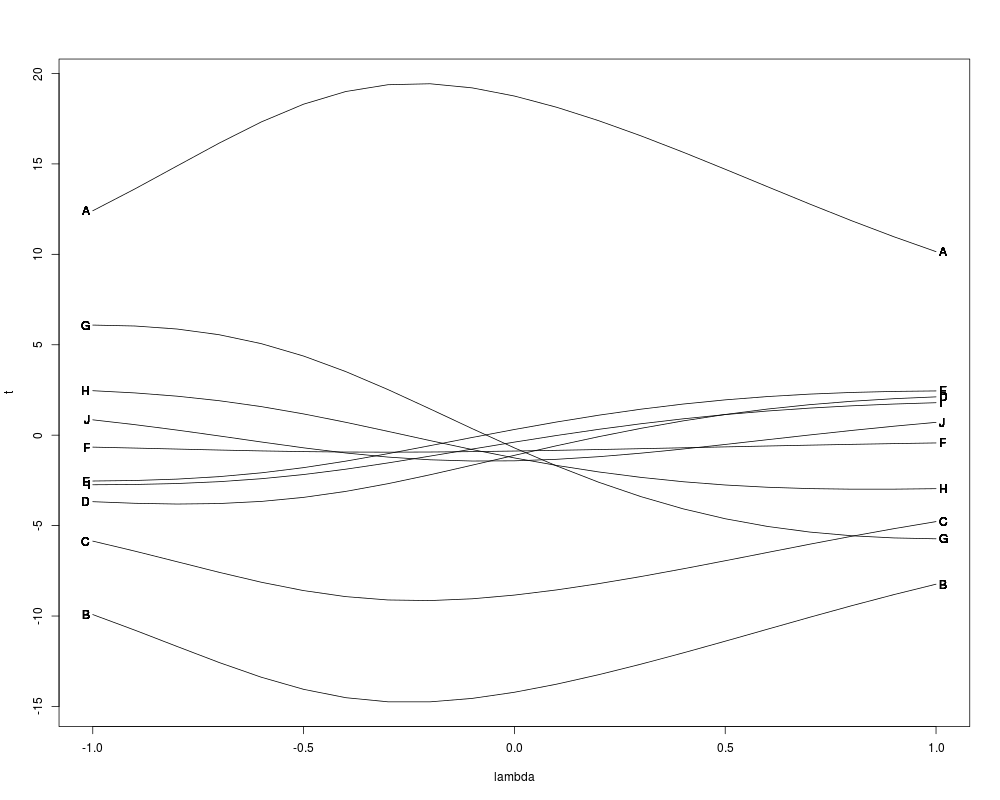
# Lambda Plot tracing t values.
data(woolen.data)
woolen.lm <- lm(y~x1+x2+x3+I(x1^2)+I(x2^2)+I(x3^2)+
I(x1*x2)+I(x1*x3)+I(x2*x3)+I(x1*x2*x3),data=woolen.data)
lambdaPlot(woolen.lm,cex=.8,stat="t")
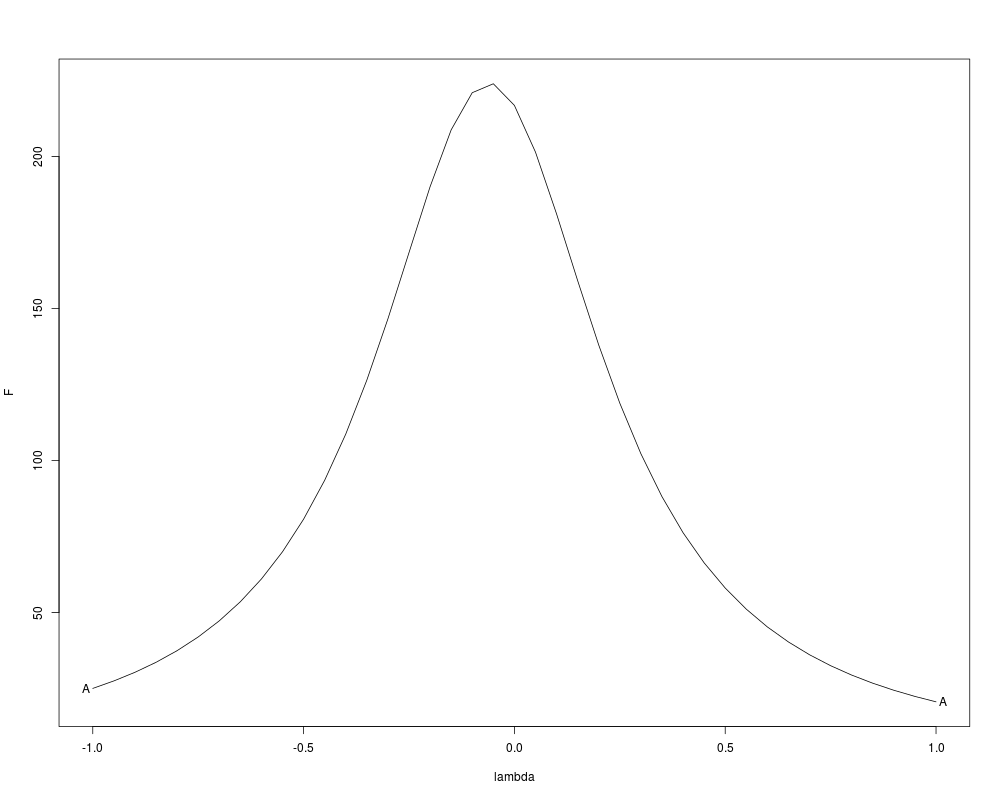
# Lambda Plot tracing F values.
woolen2.lm <- lm(y~x1+x2+x3,data=woolen.data)
lambdaPlot(woolen2.lm,lambda=seq(-1,1,length=41),stat="F",global=TRUE)
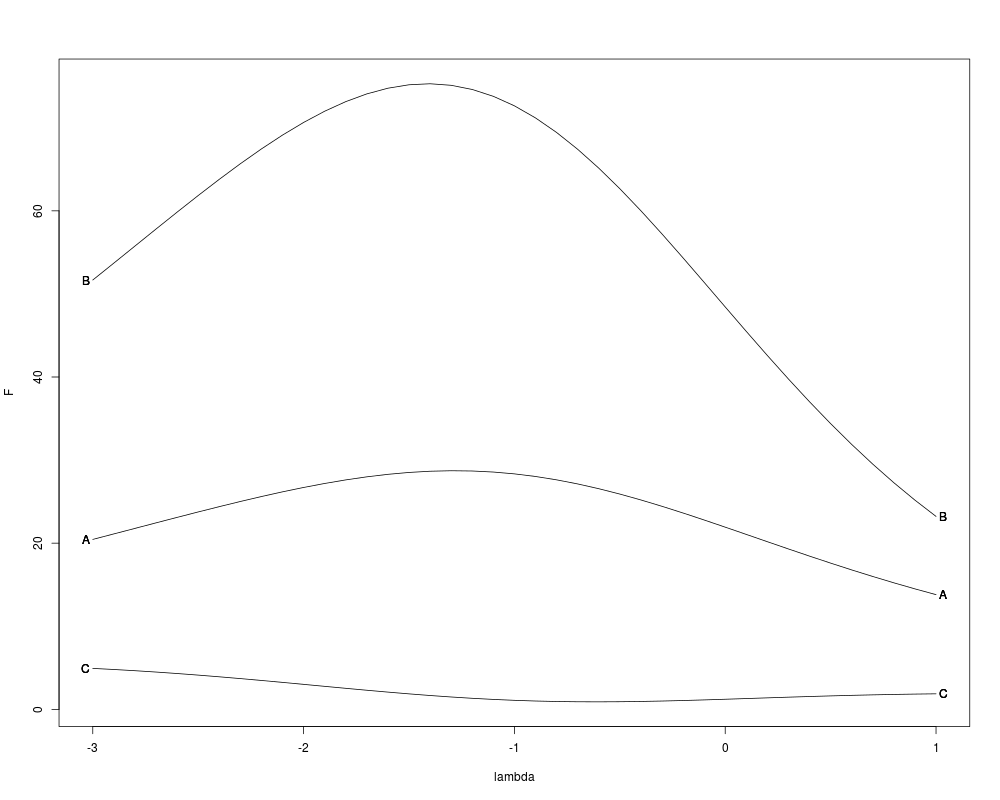
# Lambda Plot tracing F values.
data(poison.data)
poison.lm <- lm(y~treat*poison,data=poison.data)
lambdaPlot(poison.lm,lambda=seq(-3,1,by=.1),stat="F",global=FALSE)
Results
R version 3.3.1 (2016-06-21) -- "Bug in Your Hair"
Copyright (C) 2016 The R Foundation for Statistical Computing
Platform: x86_64-pc-linux-gnu (64-bit)

R is free software and comes with ABSOLUTELY NO WARRANTY.
You are welcome to redistribute it under certain conditions.
Type 'license()' or 'licence()' for distribution details.

R is a collaborative project with many contributors.
Type 'contributors()' for more information and
'citation()' on how to cite R or R packages in publications.

Type 'demo()' for some demos, 'help()' for on-line help, or
'help.start()' for an HTML browser interface to help.
Type 'q()' to quit R.

> library(BHH2)
> png(filename="/home/ddbj/snapshot/RGM3/R_CC/result/BHH2/lambdaPlot.Rd_%03d_medium.png", width=480, height=480)
> ### Name: lambdaPlot
> ### Title: Lambda plot: traces the t and F statistics in Box-Cox
> ###   transformation of the response
> ### Aliases: lambdaPlot
> ### Keywords: design hplot
>
> ### ** Examples
>
> library(BHH2)
> # Lambda Plot tracing t values.
> data(woolen.data)
> woolen.lm <- lm(y~x1+x2+x3+I(x1^2)+I(x2^2)+I(x3^2)+
+                     I(x1*x2)+I(x1*x3)+I(x2*x3)+I(x1*x2*x3),data=woolen.data)
> lambdaPlot(woolen.lm,cex=.8,stat="t")
                term label
1        (Intercept)
2                 x1     A
3                 x2     B
4                 x3     C
5          `I(x1^2)`     D
6          `I(x2^2)`     E
7          `I(x3^2)`     F
8       `I(x1 * x2)`     G
9       `I(x1 * x3)`     H
10      `I(x2 * x3)`     I
11 `I(x1 * x2 * x3)`     J
>
> # Lambda Plot tracing F values.
> woolen2.lm <- lm(y~x1+x2+x3,data=woolen.data)
> lambdaPlot(woolen2.lm,lambda=seq(-1,1,length=41),stat="F",global=TRUE)
[1] "y"
   term label
1 Model     A
>
> # Lambda Plot tracing F values.
> data(poison.data)
> poison.lm <- lm(y~treat*poison,data=poison.data)
> lambdaPlot(poison.lm,lambda=seq(-3,1,by=.1),stat="F",global=FALSE)
[1] "y"
          term label
1        treat     A
2       poison     B
3 treat:poison     C
>
>
>
>
>
> dev.off()
null device
          1
>
|