Computes a histogram with same output as in
graphics::hist.
Statistical inference is not conducted for this method.
Usage
BIFIE.hist( BIFIEobj, vars , breaks=NULL, group=NULL , group_values=NULL  )

## S3 method for class 'BIFIE.hist'
summary(object,...)

## S3 method for class 'BIFIE.hist'
plot(x,ask=TRUE,...)
Arguments
BIFIEobj
Object of class BIFIEdata
vars
Vector of variables for which statistics should be computed.
breaks
Optional vector of breaks. Otherwise, it will be automatically defined.
group
Optional grouping variable(s)
group_values
Optional vector of grouping values. This can be omitted and grouping
values will be determined automatically.
object
Object of class BIFIE.hist
x
Object of class BIFIE.hist
ask
Optional logical whether it should be asked for new plots.
...
Further arguments to be passed
Value
A list with following entries
histobj
List with objects of class histogram
output
More extensive output
...
More values
See Also
graphics::hist
Examples
#############################################################################
# EXAMPLE 1: Imputed TIMSS dataset
#############################################################################
data(data.timss1)
data(data.timssrep)
# create BIFIE.dat object
bifieobj <- BIFIE.data( data.list=data.timss1 , wgt= data.timss1[[1]]$TOTWGT ,
wgtrep=data.timssrep[, -1 ] )
# histogram
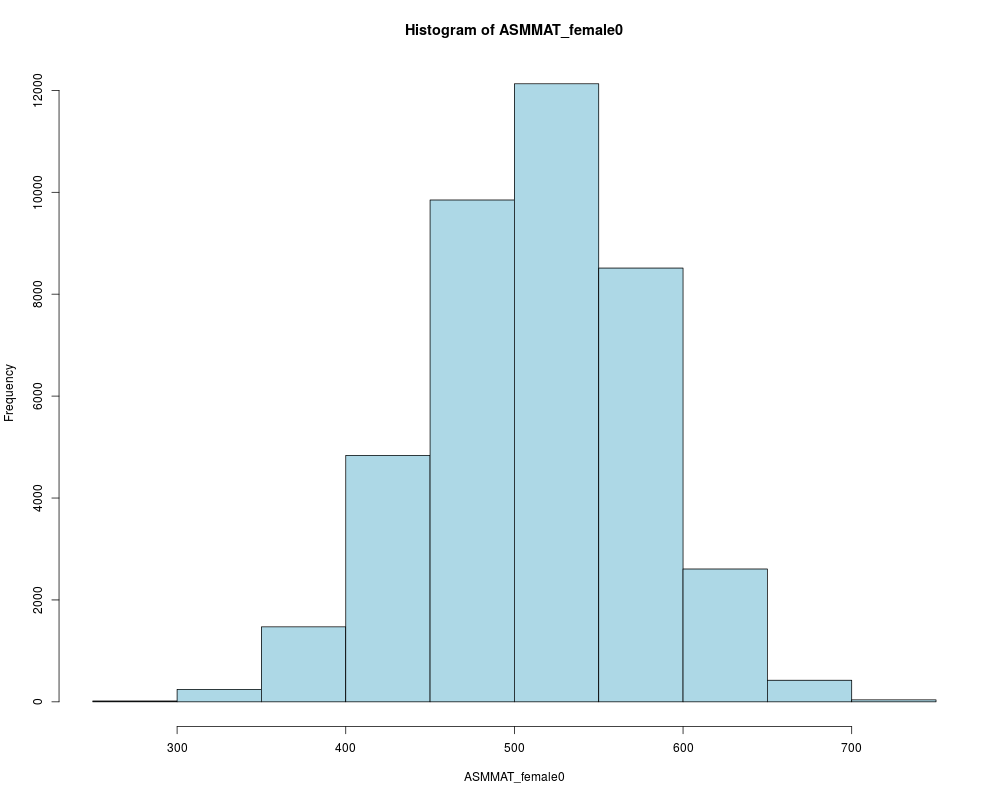
res1 <- BIFIE.hist( bifieobj , vars = "ASMMAT" , group="female" )
# plot histogram for first group (female = 0)
plot( res1$histobj$ASMMAT_female0 , col="lightblue")
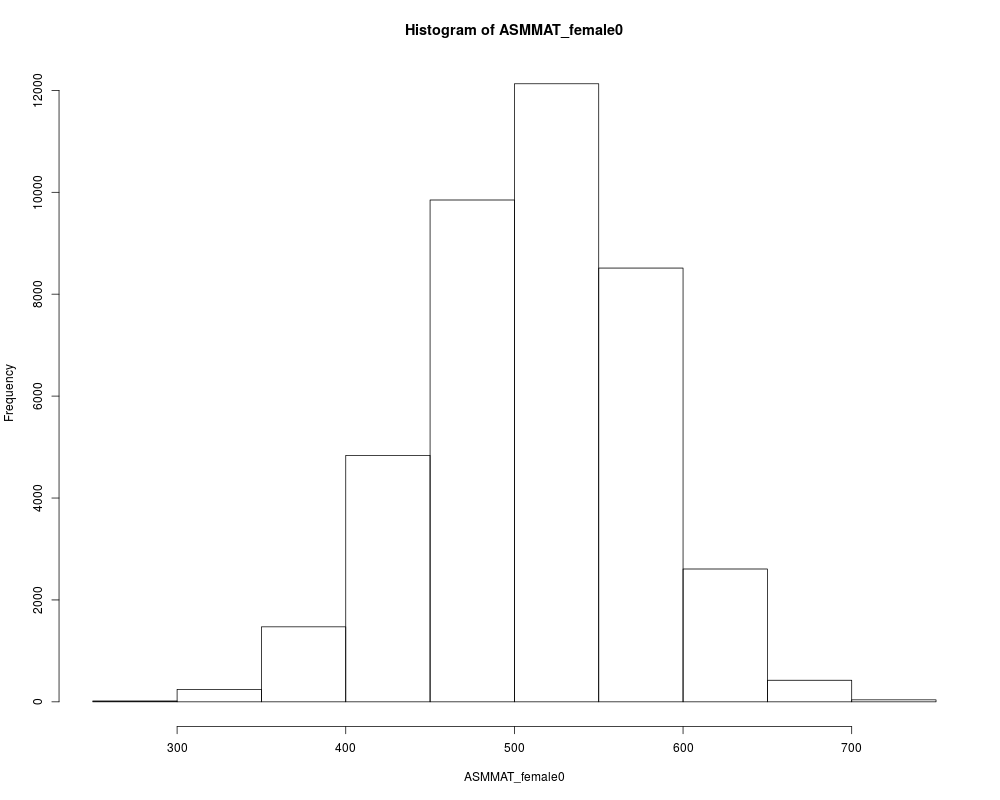
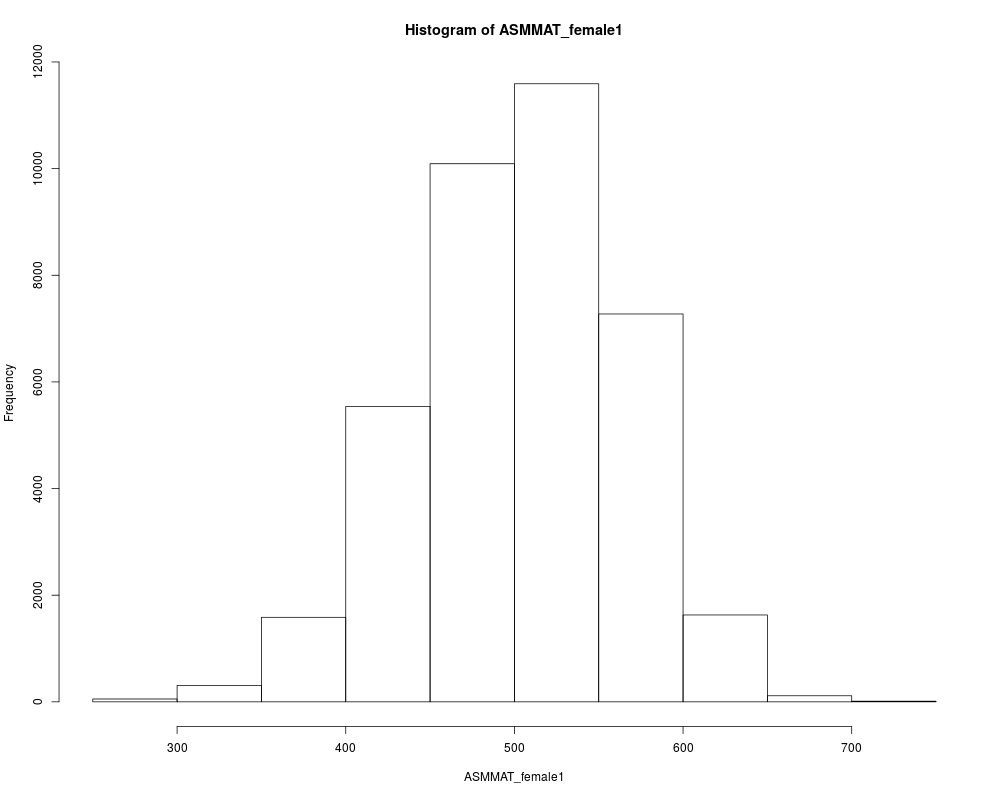
# plot both histograms after each other
plot( res1 )
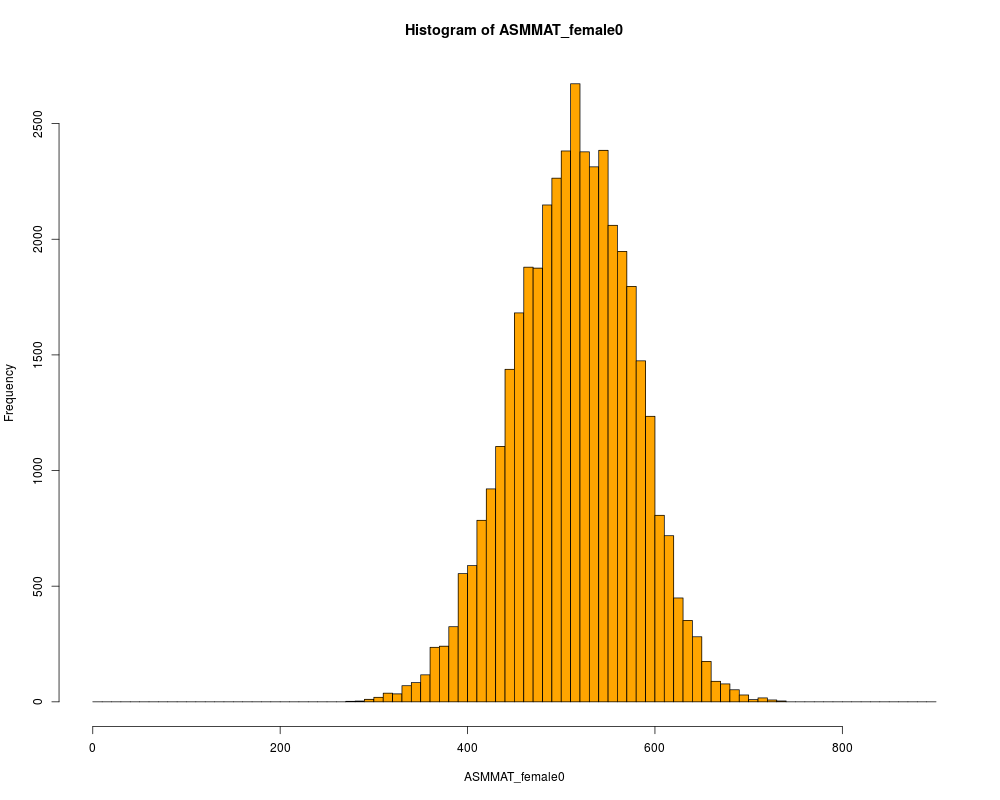
# define own break vector
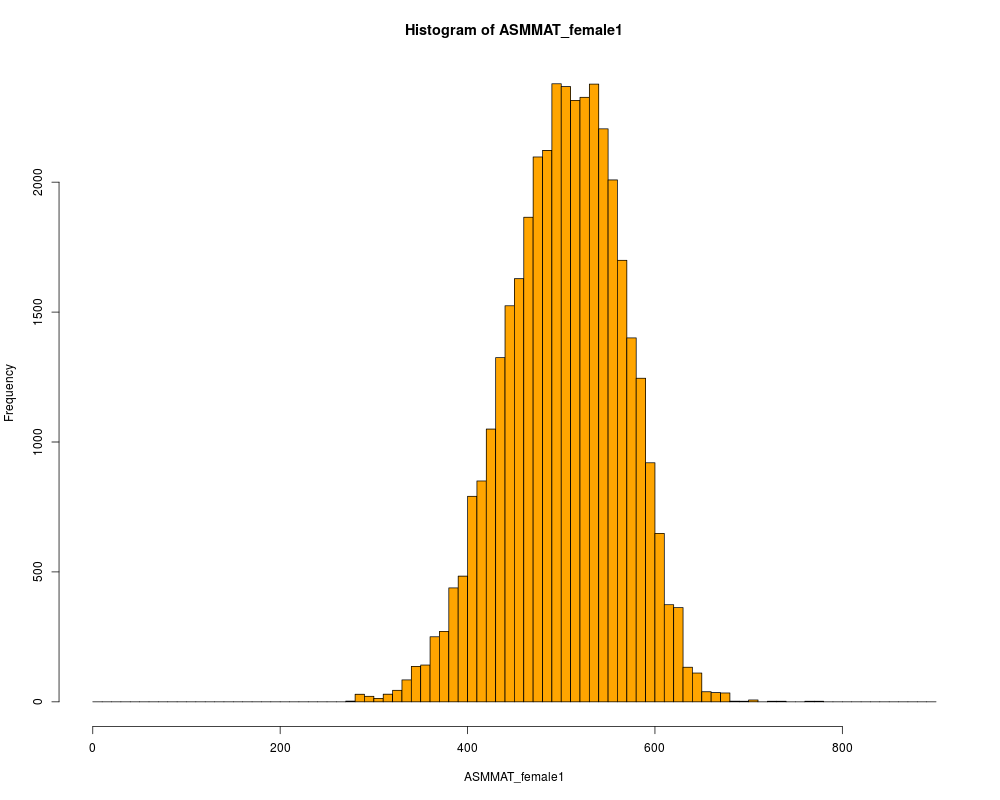
res2 <- BIFIE.hist( bifieobj , vars = "ASMMAT" , breaks=seq(0,900,10), group="female" )
plot( res2 , col="orange")
Results
R version 3.3.1 (2016-06-21) -- "Bug in Your Hair"
Copyright (C) 2016 The R Foundation for Statistical Computing
Platform: x86_64-pc-linux-gnu (64-bit)

R is free software and comes with ABSOLUTELY NO WARRANTY.
You are welcome to redistribute it under certain conditions.
Type 'license()' or 'licence()' for distribution details.

R is a collaborative project with many contributors.
Type 'contributors()' for more information and
'citation()' on how to cite R or R packages in publications.

Type 'demo()' for some demos, 'help()' for on-line help, or
'help.start()' for an HTML browser interface to help.
Type 'q()' to quit R.

> library(BIFIEsurvey)
|-----------------------------------------------------------------
| BIFIEsurvey 1.9.4-0 (2016-06-01)
| http://www.bifie.at
|-----------------------------------------------------------------

> png(filename="/home/ddbj/snapshot/RGM3/R_CC/result/BIFIEsurvey/BIFIE.hist.Rd_%03d_medium.png", width=480, height=480)
> ### Name: BIFIE.hist
> ### Title: Histogram
> ### Aliases: BIFIE.hist summary.BIFIE.hist plot.BIFIE.hist
> ### Keywords: Histogram summary plot
>
> ### ** Examples
>
> #############################################################################
> # EXAMPLE 1: Imputed TIMSS dataset
> #############################################################################
>
> data(data.timss1)
> data(data.timssrep)
>
> # create BIFIE.dat object
> bifieobj <- BIFIE.data( data.list=data.timss1 , wgt=  data.timss1[[1]]$TOTWGT ,
+            wgtrep=data.timssrep[, -1 ] )
+++ Generate BIFIE.data object
|*****|
|-----|
>
> # histogram
> res1 <- BIFIE.hist( bifieobj , vars = "ASMMAT" , group="female" )
|*****|
|-----|
> # plot histogram for first group (female = 0)
> plot( res1$histobj$ASMMAT_female0 , col="lightblue")
> # plot both histograms after each other
> plot( res1 )
>
> # define own break vector
> res2 <- BIFIE.hist( bifieobj , vars = "ASMMAT" , breaks=seq(0,900,10), group="female" )
|*****|
|-----|
> plot( res2 , col="orange")
>
>
>
>
>
> dev.off()
null device
          1
>
 .
.