Supported by Dr. Osamu Ogasawara and  . . |
|
Last data update: 2014.03.03 |
Simultaneous confidence intervals from raw estimatesDescriptionCalculates simultaneous confidence intervals for multiple contrasts based on a parameter vector, its variance-covariance matrix and (optionally) the degrees of freedom, using quantiles of the multivar Usage
simplesimint(coef, vcov, cmat, df = NULL, conf.level = 0.95,
 alternative = c("two.sided", "less", "greater"))
Arguments
DetailsImplements the methods formerly available in package multcomp, function ValueAn object of class "simplesimint"
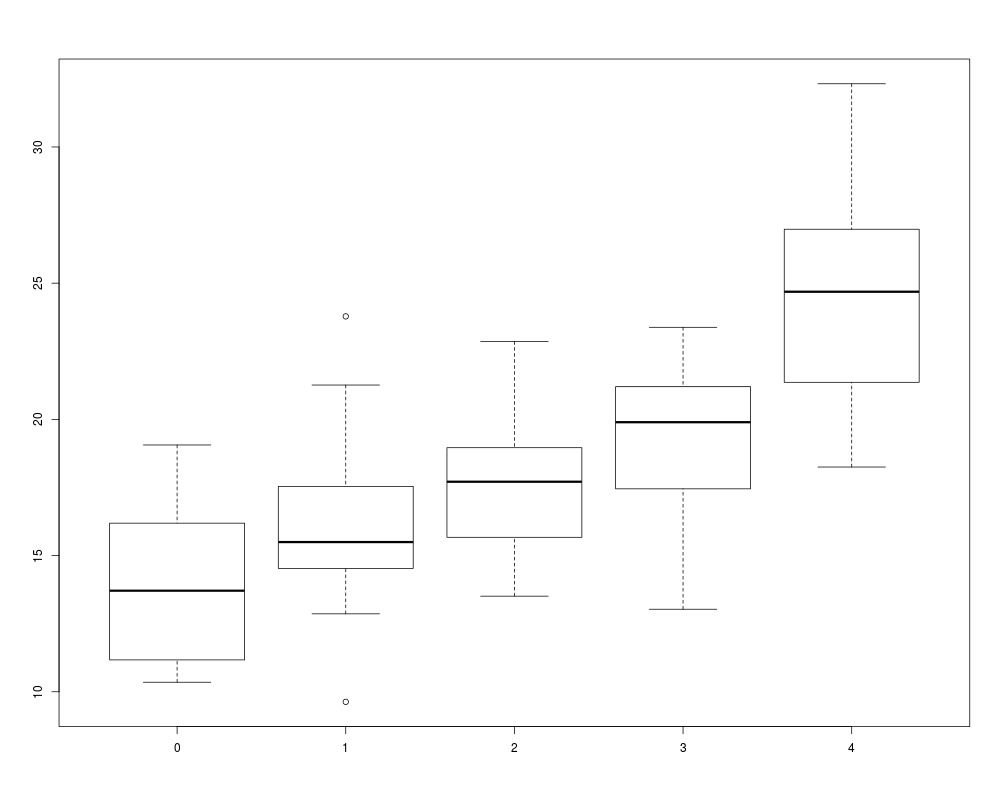
NoteThis is a testversion and has not been checked extensively. Author(s)Frank Schaarschmidt See Also See Examples# For the simple case of Gaussian response # variables with homoscedastic variance, # see the following example library(mratios) data(angina) boxplot(response ~ dose, data=angina) # Fit a cell means model, fit<-lm(response ~ 0+dose, data=angina) # extract cell means, the corresponding # variance-covariance matrix and the # residual degree of freedom, cofi<-coef(fit) vcofi<-vcov(fit) dofi<-fit$df.residual # define an appropriate contrast matrix, # here, comparisons to control n<-unlist(lapply(split(angina$response, f=angina$dose), length)) names(n)<-names(cofi) cmat<-contrMat(n=n, type="Dunnett") cmat # test<-simplesimint(coef=cofi, vcov=vcofi, df=dofi, cmat=cmat, alternative="greater" ) test summary(test) plotCI(test) ### Note, that the same result can be achieved much more conveniently ### using confint.glht in package multcomp Results
R version 3.3.1 (2016-06-21) -- "Bug in Your Hair"
Copyright (C) 2016 The R Foundation for Statistical Computing
Platform: x86_64-pc-linux-gnu (64-bit)
R is free software and comes with ABSOLUTELY NO WARRANTY.
You are welcome to redistribute it under certain conditions.
Type 'license()' or 'licence()' for distribution details.
R is a collaborative project with many contributors.
Type 'contributors()' for more information and
'citation()' on how to cite R or R packages in publications.
Type 'demo()' for some demos, 'help()' for on-line help, or
'help.start()' for an HTML browser interface to help.
Type 'q()' to quit R.
> library(BSagri)
Loading required package: gamlss
Loading required package: splines
Loading required package: gamlss.data
Loading required package: gamlss.dist
Loading required package: MASS
Loading required package: nlme
Loading required package: parallel
********** GAMLSS Version 4.4-0 **********
For more on GAMLSS look at http://www.gamlss.org/
Type gamlssNews() to see new features/changes/bug fixes.
Loading required package: multcomp
Loading required package: mvtnorm
Loading required package: survival
Attaching package: 'survival'
The following object is masked from 'package:gamlss.data':
leukemia
Loading required package: TH.data
Attaching package: 'TH.data'
The following object is masked from 'package:MASS':
geyser
Loading required package: MCPAN
> png(filename="/home/ddbj/snapshot/RGM3/R_CC/result/BSagri/simplesimint.Rd_%03d_medium.png", width=480, height=480)
> ### Name: simplesimint
> ### Title: Simultaneous confidence intervals from raw estimates
> ### Aliases: simplesimint
> ### Keywords: htest
>
> ### ** Examples
>
>
>
> # For the simple case of Gaussian response
> # variables with homoscedastic variance,
> # see the following example
>
>
> library(mratios)
> data(angina)
>
> boxplot(response ~ dose, data=angina)
>
> # Fit a cell means model,
>
> fit<-lm(response ~ 0+dose, data=angina)
>
> # extract cell means, the corresponding
> # variance-covariance matrix and the
> # residual degree of freedom,
>
> cofi<-coef(fit)
> vcofi<-vcov(fit)
> dofi<-fit$df.residual
>
> # define an appropriate contrast matrix,
> # here, comparisons to control
>
> n<-unlist(lapply(split(angina$response, f=angina$dose), length))
> names(n)<-names(cofi)
>
> cmat<-contrMat(n=n, type="Dunnett")
> cmat
Multiple Comparisons of Means: Dunnett Contrasts
dose0 dose1 dose2 dose3 dose4
dose1 - dose0 -1 1 0 0 0
dose2 - dose0 -1 0 1 0 0
dose3 - dose0 -1 0 0 1 0
dose4 - dose0 -1 0 0 0 1
>
> #
>
> test<-simplesimint(coef=cofi, vcov=vcofi, df=dofi, cmat=cmat, alternative="greater" )
>
> test
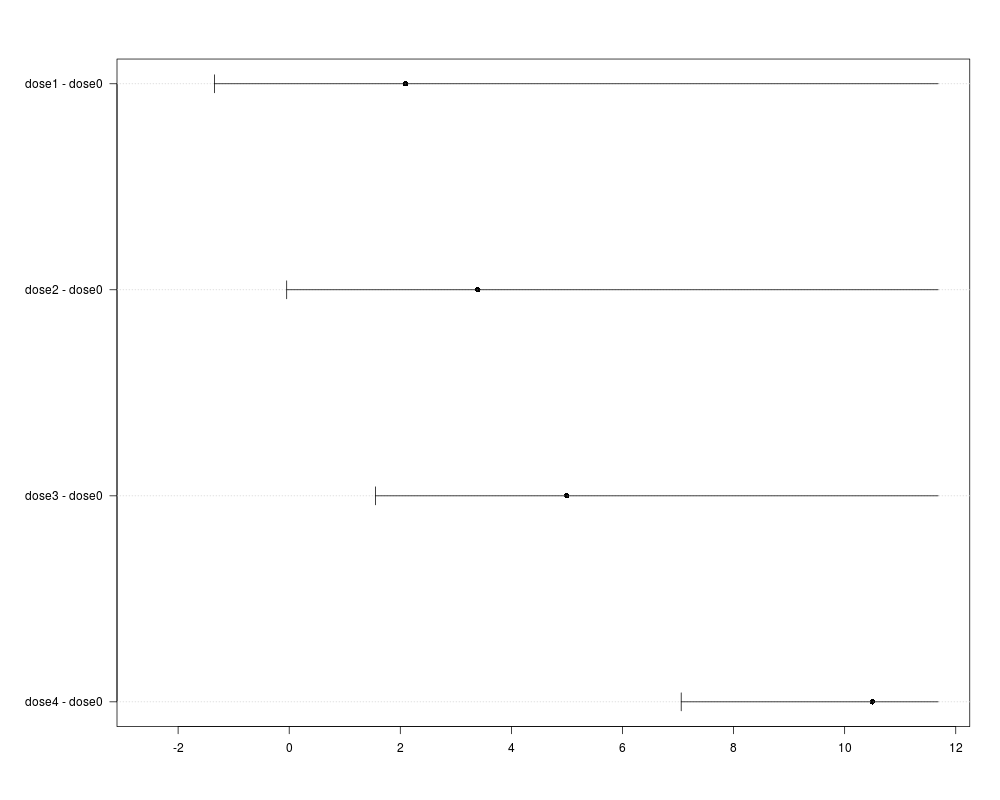
Simultaneous 95 % confidence intervals:
Estimate Lower Upper
dose1 - dose0 2.095 -1.34767238 Inf
dose2 - dose0 3.397 -0.04567238 Inf
dose3 - dose0 4.995 1.55232762 Inf
dose4 - dose0 10.499 7.05632762 Inf
>
> summary(test)
Simultaneous 95% confidence intervals:
Estimate Lower Upper
dose1 - dose0 2.095 -1.34767238 Inf
dose2 - dose0 3.397 -0.04567238 Inf
dose3 - dose0 4.995 1.55232762 Inf
dose4 - dose0 10.499 7.05632762 Inf
Used quantile: -2.2226,
obtained from a 4 -variate t-distribution
with 45 degrees of freedom.
Used contrast matrix:
Multiple Comparisons of Means: Dunnett Contrasts
dose0 dose1 dose2 dose3 dose4
dose1 - dose0 -1 1 0 0 0
dose2 - dose0 -1 0 1 0 0
dose3 - dose0 -1 0 0 1 0
dose4 - dose0 -1 0 0 0 1
Resulting variance covariance matrix of the contrasts:
dose1 - dose0 dose2 - dose0 dose3 - dose0 dose4 - dose0
dose1 - dose0 2.399287 1.199643 1.199643 1.199643
dose2 - dose0 1.199643 2.399287 1.199643 1.199643
dose3 - dose0 1.199643 1.199643 2.399287 1.199643
dose4 - dose0 1.199643 1.199643 1.199643 2.399287
Corresponding correlation matrix of the contrasts:
dose1 - dose0 dose2 - dose0 dose3 - dose0 dose4 - dose0
dose1 - dose0 1.0 0.5 0.5 0.5
dose2 - dose0 0.5 1.0 0.5 0.5
dose3 - dose0 0.5 0.5 1.0 0.5
dose4 - dose0 0.5 0.5 0.5 1.0
>
> plotCI(test)
>
> ### Note, that the same result can be achieved much more conveniently
> ### using confint.glht in package multcomp
>
>
>
>
>
>
>
> dev.off()
null device
1
>
|