R version 3.3.1 (2016-06-21) -- "Bug in Your Hair"
Copyright (C) 2016 The R Foundation for Statistical Computing
Platform: x86_64-pc-linux-gnu (64-bit)
R is free software and comes with ABSOLUTELY NO WARRANTY.
You are welcome to redistribute it under certain conditions.
Type 'license()' or 'licence()' for distribution details.
R is a collaborative project with many contributors.
Type 'contributors()' for more information and
'citation()' on how to cite R or R packages in publications.
Type 'demo()' for some demos, 'help()' for on-line help, or
'help.start()' for an HTML browser interface to help.
Type 'q()' to quit R.
> library(BiocGenerics)
Loading required package: parallel
Attaching package: 'BiocGenerics'
The following objects are masked from 'package:parallel':
clusterApply, clusterApplyLB, clusterCall, clusterEvalQ,
clusterExport, clusterMap, parApply, parCapply, parLapply,
parLapplyLB, parRapply, parSapply, parSapplyLB
The following objects are masked from 'package:stats':
IQR, mad, xtabs
The following objects are masked from 'package:base':
Filter, Find, Map, Position, Reduce, anyDuplicated, append,
as.data.frame, cbind, colnames, do.call, duplicated, eval, evalq,
get, grep, grepl, intersect, is.unsorted, lapply, lengths, mapply,
match, mget, order, paste, pmax, pmax.int, pmin, pmin.int, rank,
rbind, rownames, sapply, setdiff, sort, table, tapply, union,
unique, unsplit
> png(filename="/home/ddbj/snapshot/RGM3/R_BC/result/BiocGenerics/plotPCA.Rd_%03d_medium.png", width=480, height=480)
> ### Name: plotPCA
> ### Title: PCA-plot: Principal Component Analysis plot
> ### Aliases: plotPCA plotPCA,ANY-method
> ### Keywords: methods
>
> ### ** Examples
>
> showMethods("plotPCA")
Function: plotPCA (package BiocGenerics)
<No methods>
>
> suppressWarnings(
+ if(require("DESeq2"))
+ example("plotPCA", package="DESeq2", local=TRUE)
+ )
Loading required package: DESeq2
Loading required package: S4Vectors
Loading required package: stats4
Attaching package: 'S4Vectors'
The following objects are masked from 'package:base':
colMeans, colSums, expand.grid, rowMeans, rowSums
Loading required package: IRanges
Loading required package: GenomicRanges
Loading required package: GenomeInfoDb
Loading required package: SummarizedExperiment
Loading required package: Biobase
Welcome to Bioconductor
Vignettes contain introductory material; view with
'browseVignettes()'. To cite Bioconductor, see
'citation("Biobase")', and for packages 'citation("pkgname")'.
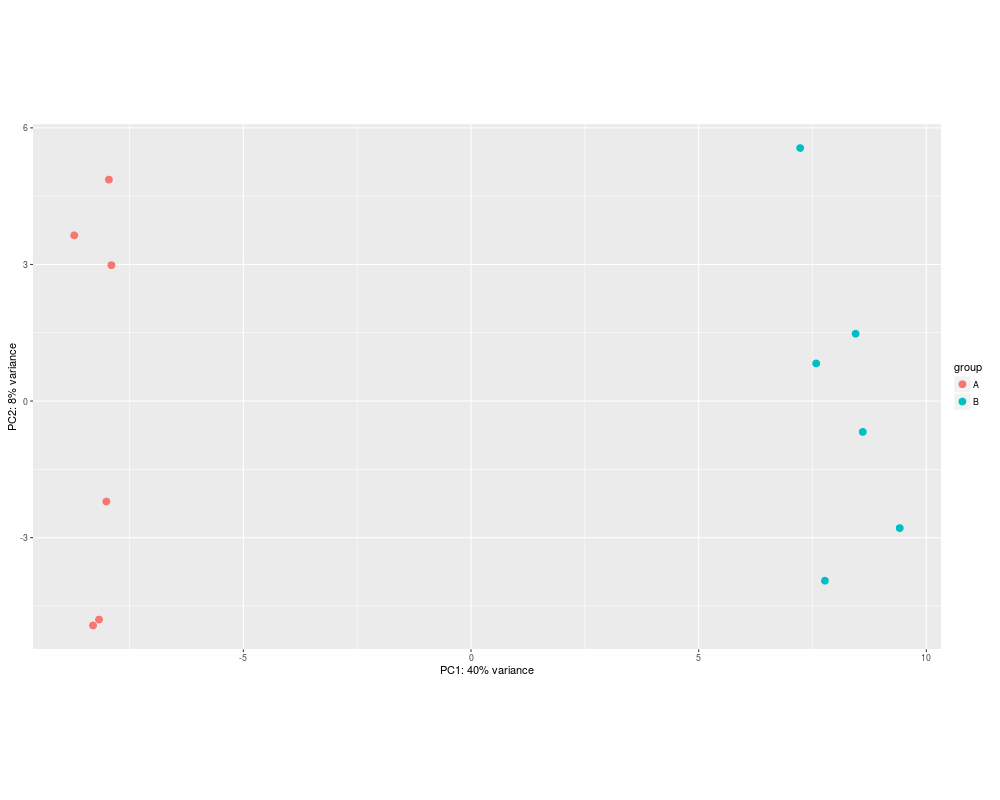
pltPCA> # using rlog transformed data:
pltPCA> dds <- makeExampleDESeqDataSet(betaSD=1)
pltPCA> rld <- rlog(dds)
pltPCA> plotPCA(rld)
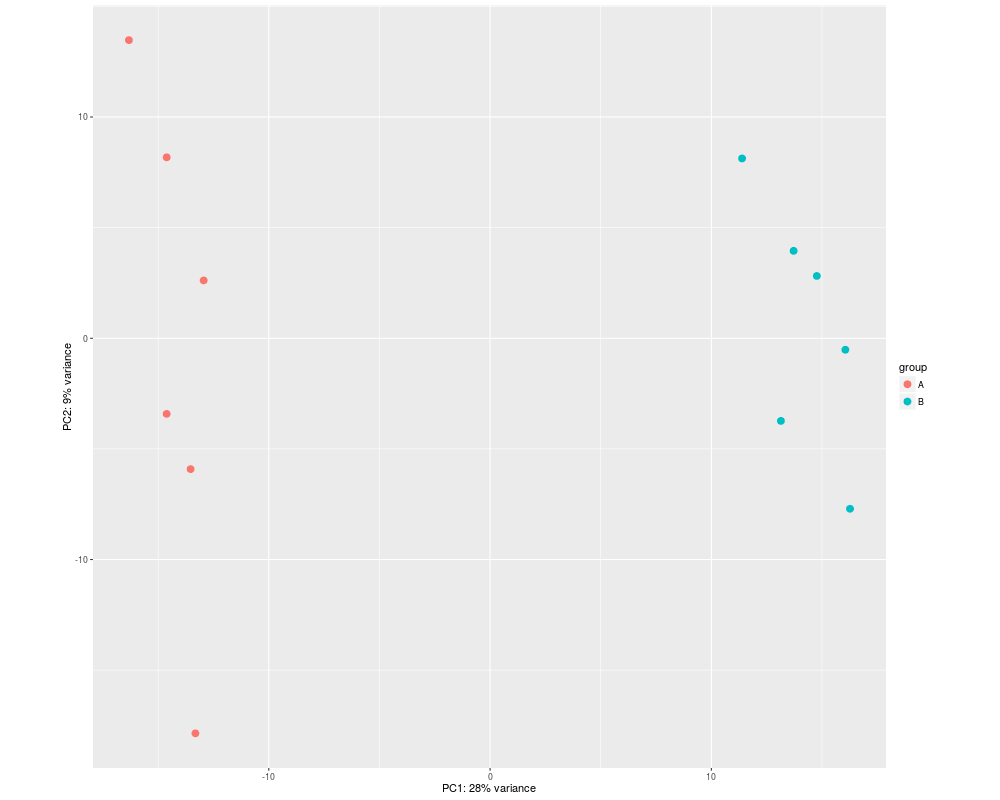
pltPCA> # also possible to perform custom transformation:
pltPCA> dds <- estimateSizeFactors(dds)
pltPCA> # shifted log of normalized counts
pltPCA> se <- SummarizedExperiment(log2(counts(dds, normalized=TRUE) + 1),
pltPCA+ colData=colData(dds))
pltPCA> # the call to DESeqTransform() is needed to
pltPCA> # trigger our plotPCA method.
pltPCA> plotPCA( DESeqTransform( se ) )
>
>
>
>
>
> dev.off()
null device
1
>
 .
.