a vector of observations from a normal distribution with unknown
mean and known std. deviation.
m.x
the mean of the normal prior
s.x
the standard deviation of the normal prior
sigma.x
the population std. deviation of the normal distribution. If
this value is NULL, which it is by default, then a flat prior is used and
m.x and s.x are ignored
mu
a vector of prior possibilities for the true mean. If this is null,
then a set of values centered on the sample mean is used.
n.mu
the number of possible mu values in the prior
plot
if TRUE then a plot showing the prior and the posterior
will be produced.
Value
A list will be returned with the following components:
mu
the
vector of possible mu values used in the prior
mu.prior
the associated probability mass for the values in
mu
likelihood
the scaled likelihood function for
mu given x and sigma.x
posterior
the posterior probability of mu given x
and sigma.x
mean
the posterior mean
sd
the
posterior standard deviation
qtls
a selection of quantiles from the
posterior density
See Also
normdpnormgcp
Examples
## generate a sample of 20 observations from a N(-0.5,1) population
x = rnorm(20,-0.5,1)

## find the posterior density with a N(0,1) prior on mu
normnp(x,sigma=1)

## find the posterior density with N(0.5,3) prior on mu
normnp(x,0.5,3,1)

## Find the posterior density for mu, given a random sample of 4
## observations from N(mu,sigma^2=1), y = [2.99, 5.56, 2.83, 3.47],
## and a N(3,sd=2)$ prior for mu
y = c(2.99,5.56,2.83,3.47)
normnp(y,3,2,1)
Results
R version 3.3.1 (2016-06-21) -- "Bug in Your Hair"
Copyright (C) 2016 The R Foundation for Statistical Computing
Platform: x86_64-pc-linux-gnu (64-bit)
R is free software and comes with ABSOLUTELY NO WARRANTY.
You are welcome to redistribute it under certain conditions.
Type 'license()' or 'licence()' for distribution details.
R is a collaborative project with many contributors.
Type 'contributors()' for more information and
'citation()' on how to cite R or R packages in publications.
Type 'demo()' for some demos, 'help()' for on-line help, or
'help.start()' for an HTML browser interface to help.
Type 'q()' to quit R.
> library(Bolstad)
Attaching package: 'Bolstad'
The following objects are masked from 'package:stats':
IQR, sd, var
> png(filename="/home/ddbj/snapshot/RGM3/R_CC/result/Bolstad/normnp.Rd_%03d_medium.png", width=480, height=480)
> ### Name: normnp
> ### Title: Bayesian inference on a normal mean with a normal prior
> ### Aliases: normnp
> ### Keywords: misc
>
> ### ** Examples
>
>
> ## generate a sample of 20 observations from a N(-0.5,1) population
> x = rnorm(20,-0.5,1)
>
> ## find the posterior density with a N(0,1) prior on mu
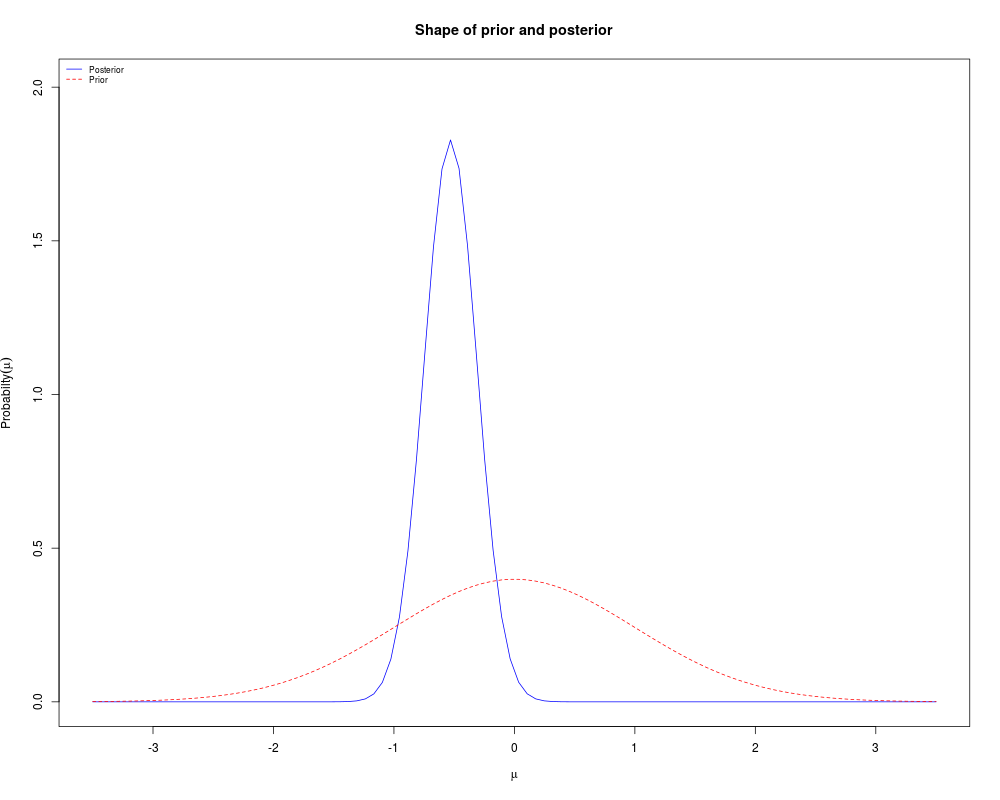
> normnp(x,sigma=1)
Known standard deviation :1
Posterior mean : -0.6109201
Posterior std. deviation : 0.2182179
Prob. Quantile
------ ----------
0.005 -1.1730121
0.010 -1.1185708
0.025 -1.0386193
0.050 -0.9698566
0.500 -0.6109201
0.950 -0.2519836
0.975 -0.1832209
0.990 -0.1032694
0.995 -0.0488280
>
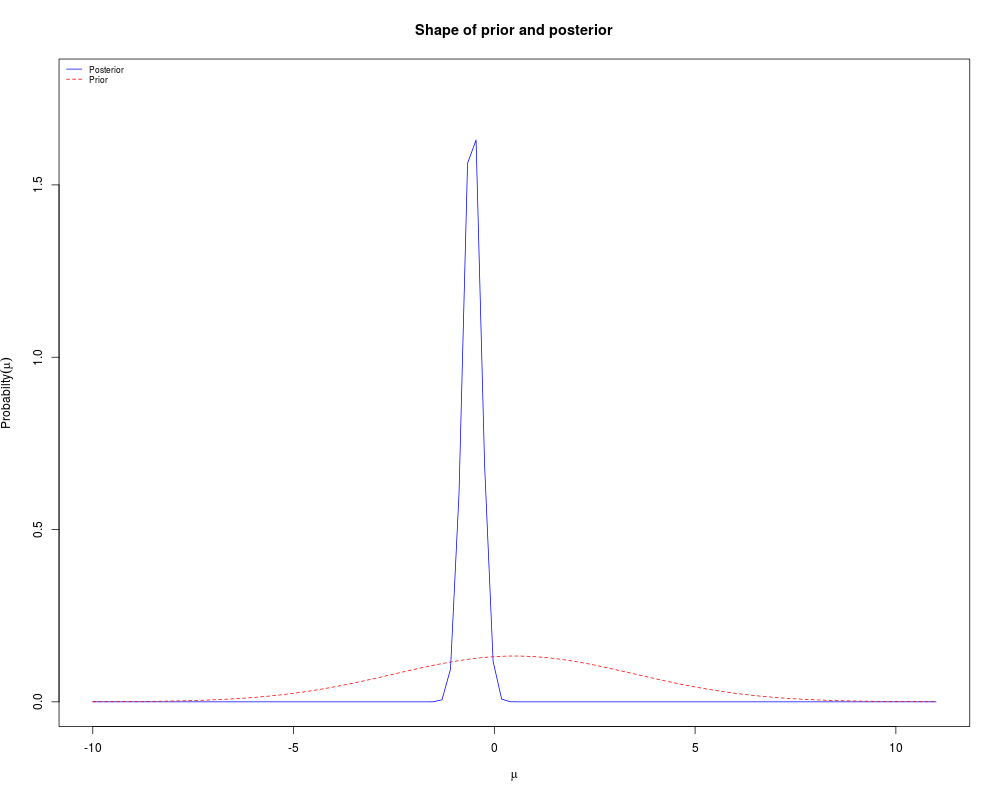
> ## find the posterior density with N(0.5,3) prior on mu
> normnp(x,0.5,3,1)
Known standard deviation :1
Posterior mean : -0.6351596
Posterior std. deviation : 0.2229882
Prob. Quantile
------ ----------
0.005 -1.2095393
0.010 -1.1539079
0.025 -1.0722086
0.050 -1.0019427
0.500 -0.6351596
0.950 -0.2683766
0.975 -0.1981107
0.990 -0.1164114
0.995 -0.0607800
>
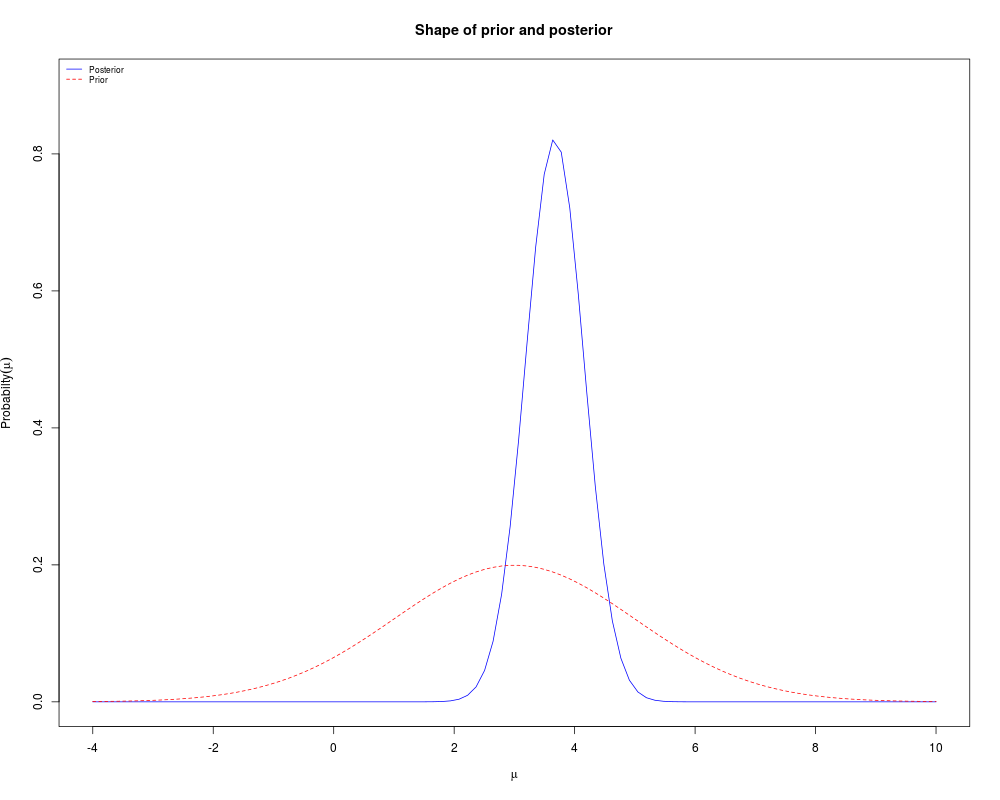
> ## Find the posterior density for mu, given a random sample of 4
> ## observations from N(mu,sigma^2=1), y = [2.99, 5.56, 2.83, 3.47],
> ## and a N(3,sd=2)$ prior for mu
> y = c(2.99,5.56,2.83,3.47)
> normnp(y,3,2,1)
Known standard deviation :1
Posterior mean : 3.6705882
Posterior std. deviation : 0.4850713
Prob. Quantile
------ ----------
0.005 2.4211275
0.010 2.5421438
0.025 2.7198661
0.050 2.8727170
0.500 3.6705882
0.950 4.4684594
0.975 4.6213104
0.990 4.7990327
0.995 4.9200490
>
>
>
>
>
>
> dev.off()
null device
1
>
 .
.