A unified plotting method for plotting the prior, likelihood and posterior
from any of the analyses in the book
Usage
## S3 method for class 'Bolstad'
plot(x, overlay = TRUE, which = c(1, 3),
  densCols = c("red", "green", "blue")[which], legendLoc = "topleft",
  scaleLike = FALSE, xlab = eval(expression(x$name)), ylab = "",
  main = "Shape of prior and posterior", ylim = c(0, max(cbind(x$prior,
  x$likelihood, x$posterior)[, which]) * 1.1), cex = 0.7, ...)
Arguments
x
A S3 object of class Bolstad
overlay
if FALSE then up to three plots will be drawn
side-by-side
which
Control which of the prior = 1, likelihood = 2, and posterior =
3, are plots. This is set to prior and posterior by default to retain
compatibility with the book
densCols
The colors of the lines for each of the prior, likelihood and
posterior
legendLoc
The location of the legend, usually either "topright"
or "topleft"
scaleLike
If TRUE, then the likelihood will be scaled to have
approximately the same maximum value as the posterior
xlab
Label for x axis
ylab
Label for y axis
main
Title of plot
ylim
Vector giving y coordinate range
cex
Character expansion multiplier
...
Any remaining arguments are fed to the plot command
Details
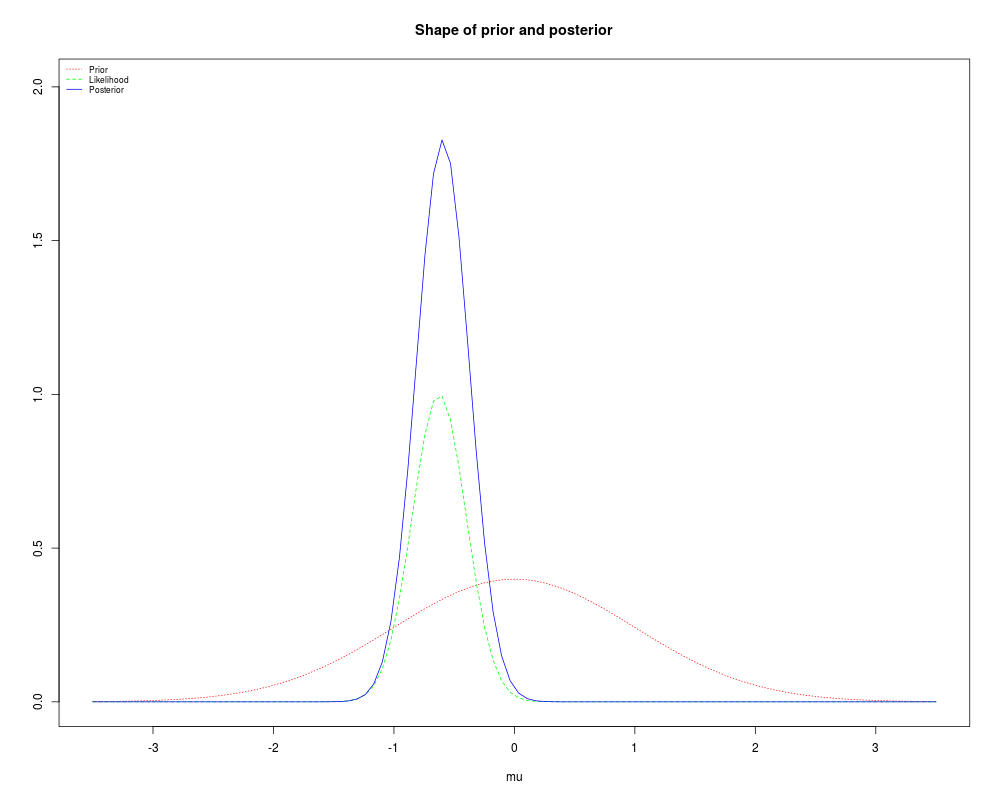
The function provides a unified way of plotting the prior, likelihood and
posterior from any of the functions in the library that return these
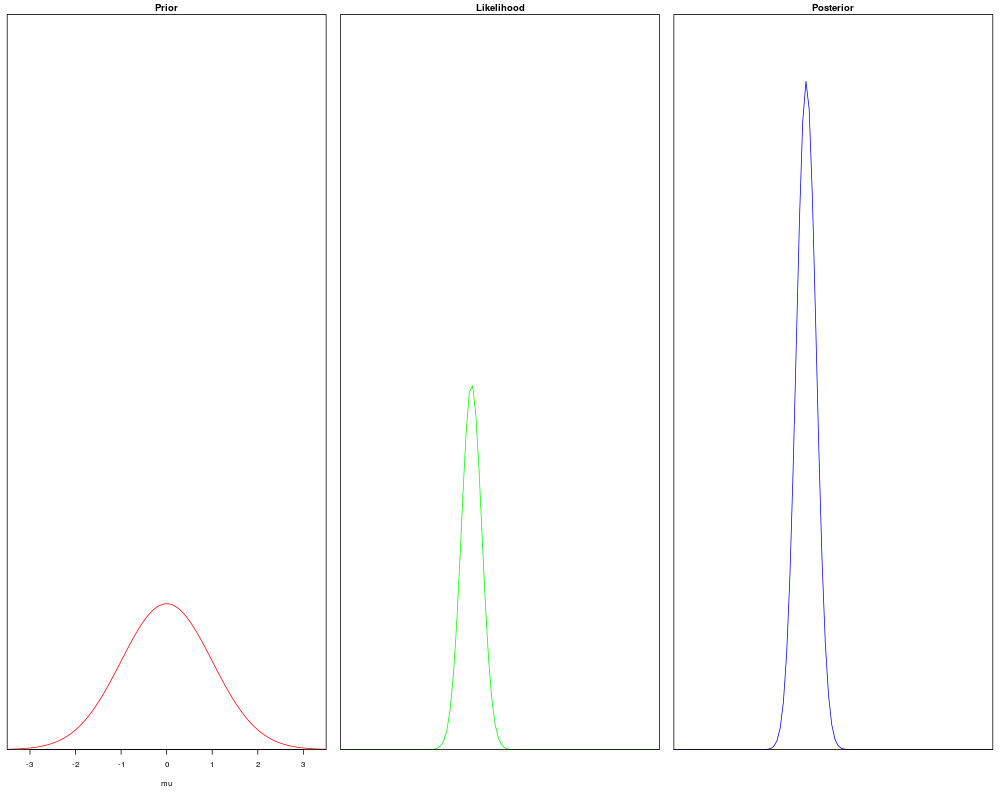
quantities. It will produce an overlay of the lines by default, or separate
panels if overlay = FALSE.
Author(s)
James Curran
Examples
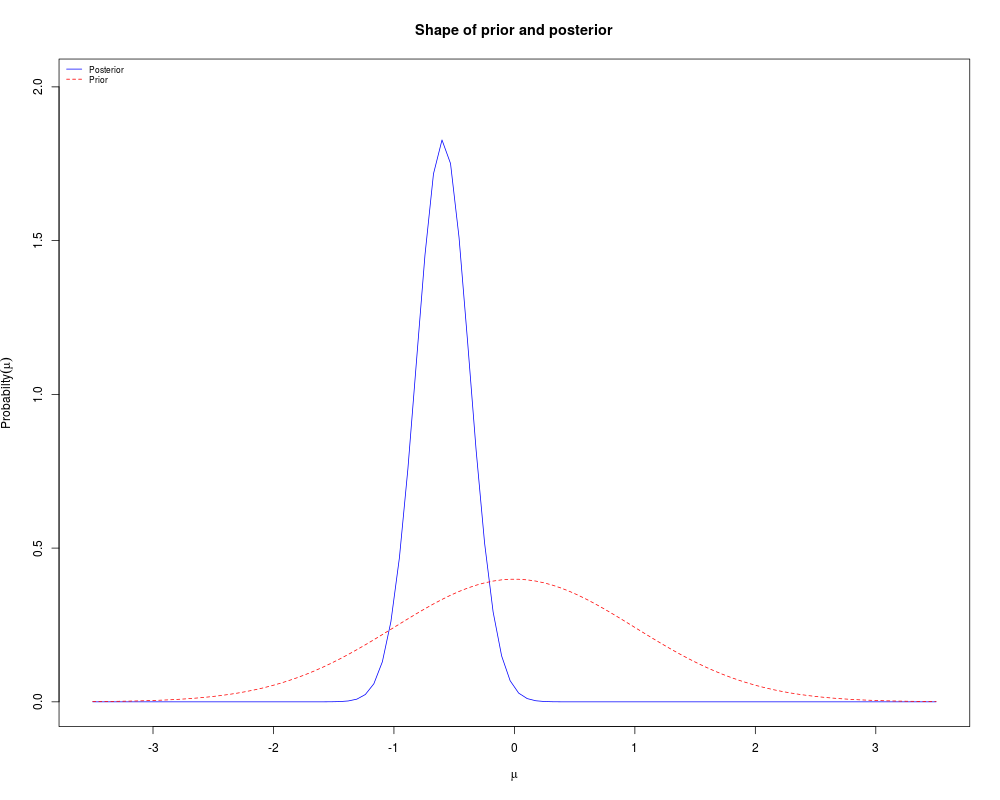
x = rnorm(20,-0.5,1)
## find the posterior density with a N(0,1) prior on mu
b = normnp(x,sigma=1)
plot(b)
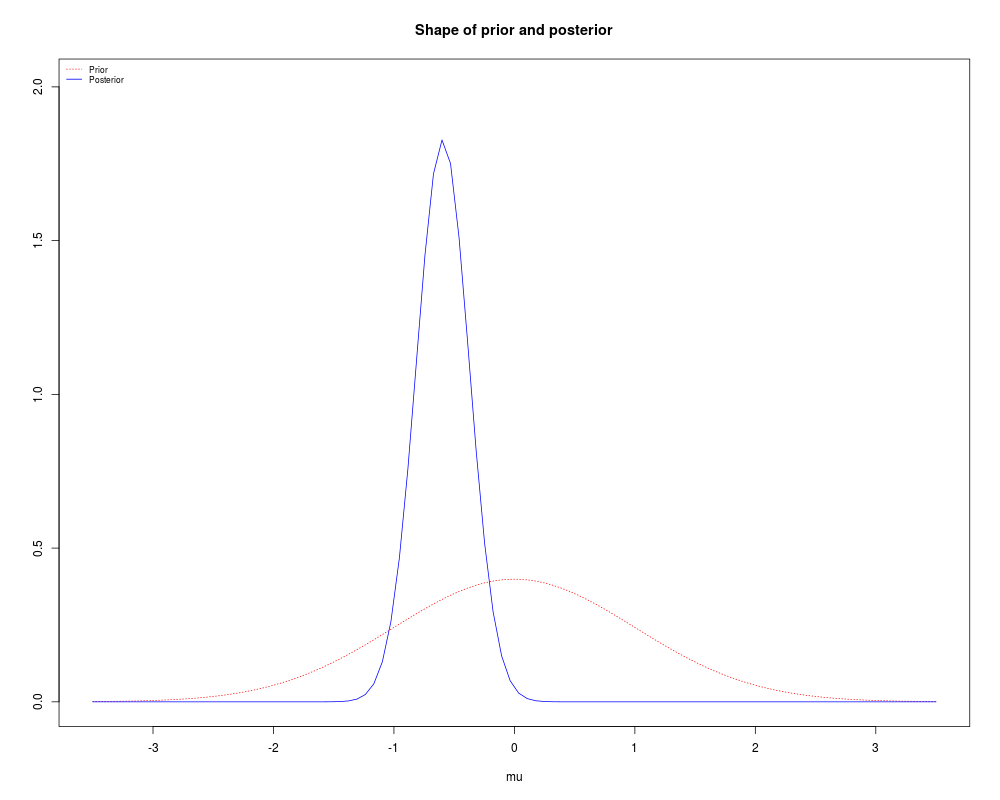
plot(b, which = 1:3)
plot(b, overlay = FALSE, which = 1:3)
Results
R version 3.3.1 (2016-06-21) -- "Bug in Your Hair"
Copyright (C) 2016 The R Foundation for Statistical Computing
Platform: x86_64-pc-linux-gnu (64-bit)

R is free software and comes with ABSOLUTELY NO WARRANTY.
You are welcome to redistribute it under certain conditions.
Type 'license()' or 'licence()' for distribution details.

R is a collaborative project with many contributors.
Type 'contributors()' for more information and
'citation()' on how to cite R or R packages in publications.

Type 'demo()' for some demos, 'help()' for on-line help, or
'help.start()' for an HTML browser interface to help.
Type 'q()' to quit R.

> library(Bolstad)

Attaching package: 'Bolstad'

The following objects are masked from 'package:stats':

    IQR, sd, var

> png(filename="/home/ddbj/snapshot/RGM3/R_CC/result/Bolstad/plot.Bolstad.Rd_%03d_medium.png", width=480, height=480)
> ### Name: plot.Bolstad
> ### Title: Plot method for objects of type Bolstad
> ### Aliases: plot.Bolstad
> ### Keywords: plot
>
> ### ** Examples
>
>
> x = rnorm(20,-0.5,1)
> ## find the posterior density with a N(0,1) prior on mu
> b = normnp(x,sigma=1)
Known standard deviation :1
Posterior mean           : -0.5957083
Posterior std. deviation : 0.2182179

Prob.	Quantile
------	----------
0.005	-1.1578003
0.010	-1.1033590
0.025	-1.0234075
0.050	-0.9546448
0.500	-0.5957083
0.950	-0.2367718
0.975	-0.1680091
0.990	-0.0880576
0.995	-0.0336163
> plot(b)
> plot(b, which = 1:3)
> plot(b, overlay = FALSE, which = 1:3)
>
>
>
>
>
> dev.off()
null device
          1
>
 .
.