Supported by Dr. Osamu Ogasawara and  . . |
|
Last data update: 2014.03.03 |
Numerical integration using Simpson's RuleDescriptionTakes a vector of x values and a corresponding set of postive f(x)=y values, or a function, and evaluates the area under the curve: int{f(x)dx} . Usagesintegral(x, fx, n.pts = max(256, length(x))) Arguments
ValueA list containing two elements, Examples
## integrate the normal density from -3 to 3
x = seq(-3, 3, length = 100)
fx = dnorm(x)
estimate = sintegral(x,fx)$value
true.val = diff(pnorm(c(-3,3)))
abs.error = abs(estimate-true.val)
rel.pct.error = 100*abs(estimate-true.val)/true.val
cat(paste("Absolute error :",round(abs.error,7),"\n"))
cat(paste("Relative percentage error :",round(rel.pct.error,6),"percent\n"))
## repeat the example above using dnorm as function
x = seq(-3, 3, length = 100)
estimate = sintegral(x,dnorm)$value
true.val = diff(pnorm(c(-3,3)))
abs.error = abs(estimate-true.val)
rel.pct.error = 100*abs(estimate-true.val)/true.val
cat(paste("Absolute error :",round(abs.error,7),"\n"))
cat(paste("Relative percentage error :",round(rel.pct.error,6)," percent\n"))
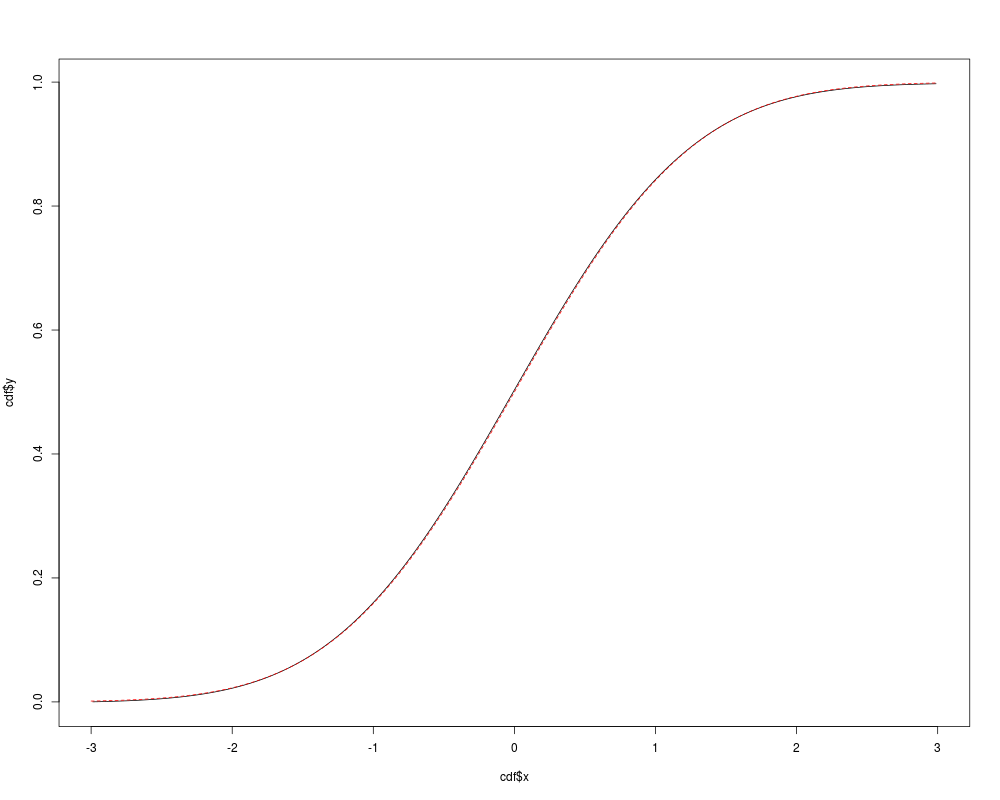
## use the cdf
cdf = sintegral(x,dnorm)$cdf
plot(cdf, type = 'l', col = "black")
lines(x, pnorm(x), col = "red", lty = 2)
## integrate the function x^2-1 over the range 1-2
x = seq(1,2,length = 100)
sintegral(x,function(x){x^2-1})$value
## compare to integrate
integrate(function(x){x^2-1},1,2)
Results
R version 3.3.1 (2016-06-21) -- "Bug in Your Hair"
Copyright (C) 2016 The R Foundation for Statistical Computing
Platform: x86_64-pc-linux-gnu (64-bit)

R is free software and comes with ABSOLUTELY NO WARRANTY.
You are welcome to redistribute it under certain conditions.
Type 'license()' or 'licence()' for distribution details.

R is a collaborative project with many contributors.
Type 'contributors()' for more information and
'citation()' on how to cite R or R packages in publications.

Type 'demo()' for some demos, 'help()' for on-line help, or
'help.start()' for an HTML browser interface to help.
Type 'q()' to quit R.

> library(Bolstad)

Attaching package: 'Bolstad'

The following objects are masked from 'package:stats':

    IQR, sd, var

> png(filename="/home/ddbj/snapshot/RGM3/R_CC/result/Bolstad/sintegral.Rd_%03d_medium.png", width=480, height=480)
> ### Name: sintegral
> ### Title: Numerical integration using Simpson's Rule
> ### Aliases: sintegral
> ### Keywords: misc
>
> ### ** Examples
>
>
> ## integrate the normal density from -3 to 3
> x = seq(-3, 3, length = 100)
> fx = dnorm(x)
> estimate = sintegral(x,fx)$value
> true.val = diff(pnorm(c(-3,3)))
> abs.error = abs(estimate-true.val)
> rel.pct.error =  100*abs(estimate-true.val)/true.val
> cat(paste("Absolute error :",round(abs.error,7),"\n"))
Absolute error : 8.1e-06
> cat(paste("Relative percentage error :",round(rel.pct.error,6),"percent\n"))
Relative percentage error : 0.000816 percent
>
> ## repeat the example above using dnorm as function
> x = seq(-3, 3, length = 100)
> estimate = sintegral(x,dnorm)$value
> true.val = diff(pnorm(c(-3,3)))
> abs.error = abs(estimate-true.val)
> rel.pct.error =  100*abs(estimate-true.val)/true.val
> cat(paste("Absolute error :",round(abs.error,7),"\n"))
Absolute error : 8.1e-06
> cat(paste("Relative percentage error :",round(rel.pct.error,6)," percent\n"))
Relative percentage error : 0.000816  percent
>
> ## use the cdf
>
> cdf = sintegral(x,dnorm)$cdf
> plot(cdf, type = 'l', col = "black")
> lines(x, pnorm(x), col = "red", lty = 2)
>
> ## integrate the function x^2-1 over the range 1-2
> x = seq(1,2,length = 100)
> sintegral(x,function(x){x^2-1})$value
[1] 1.33335
>
> ## compare to integrate
> integrate(function(x){x^2-1},1,2)
1.333333 with absolute error < 1.5e-14
>
>
>
>
>
>
>
> dev.off()
null device
          1
>
|
Created & Maintained by Osamu Ogasawara (osamu.ogasawara@gmail.com) and 