R: Monte Carlo study of randomized and blocked designs
xdesign
R Documentation
Monte Carlo study of randomized and blocked designs
Description
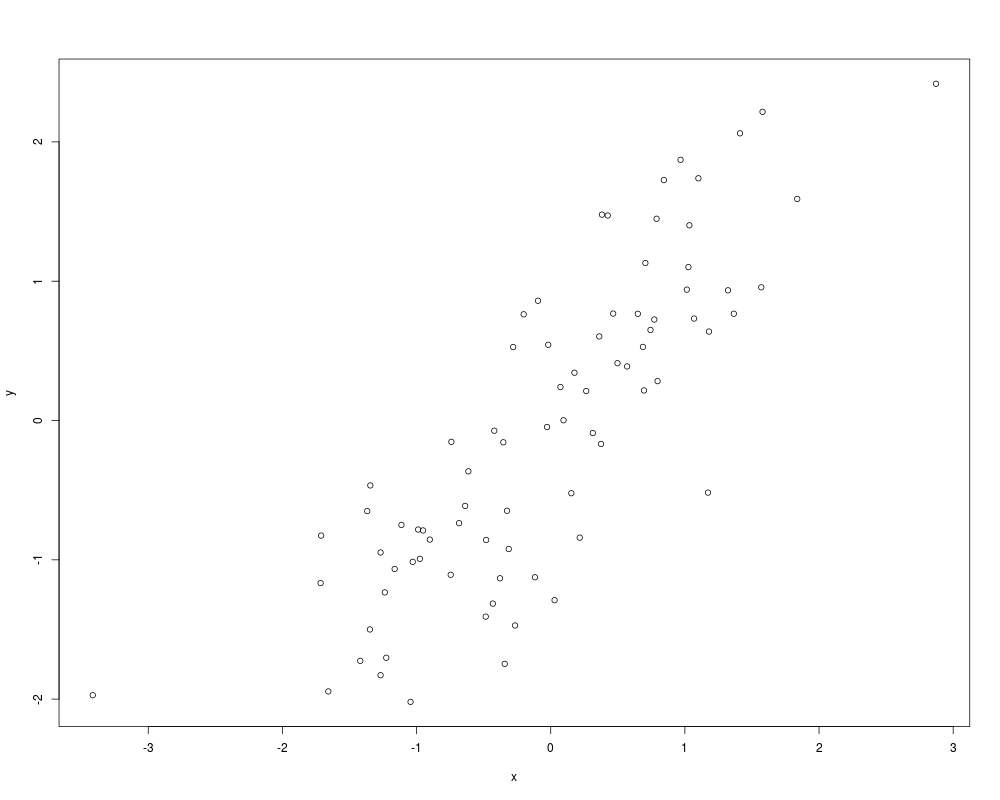
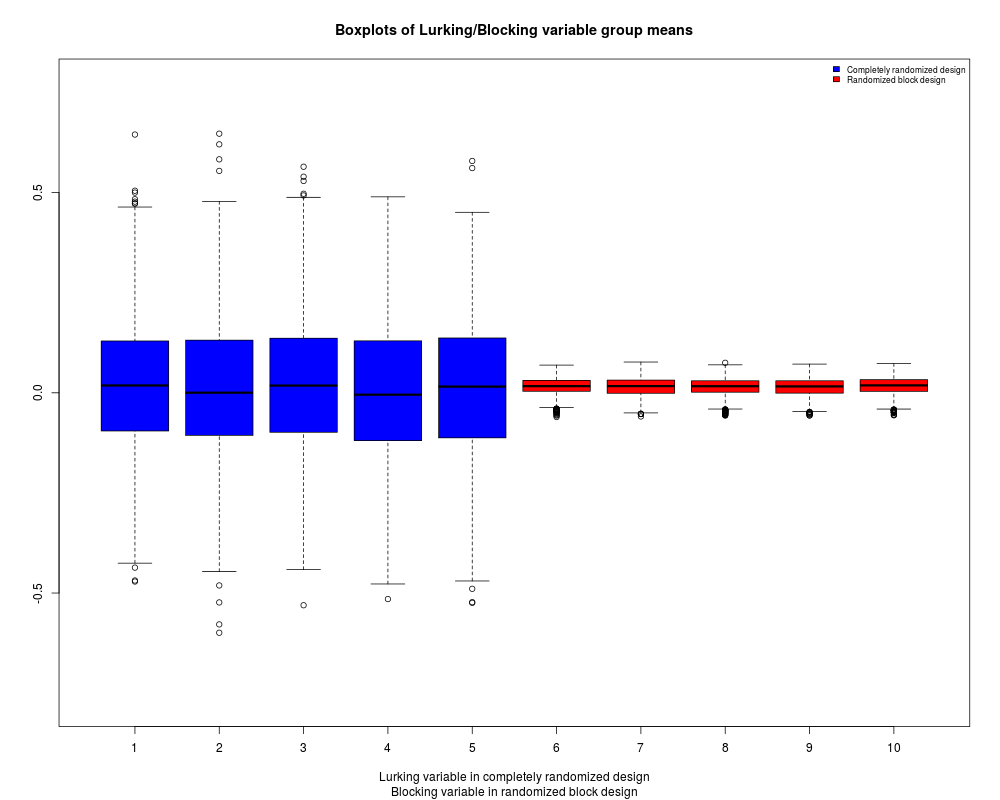
Simulates completely randomized design and randomized block designs from a
population of experimental units with underlying response values y and
underlying other variable values x (possibly lurking)
a set of lurking values which are correlated with the response
y
a set of response values
corr
the correlation between the response and lurking variable
size
the size of the treatment groups
n.treatments
the number of treatments
n.rep
the number of Monte Carlo replicates
Value
If the ouput of xdesign is assigned to a variable, then a list is
returned with the following components:
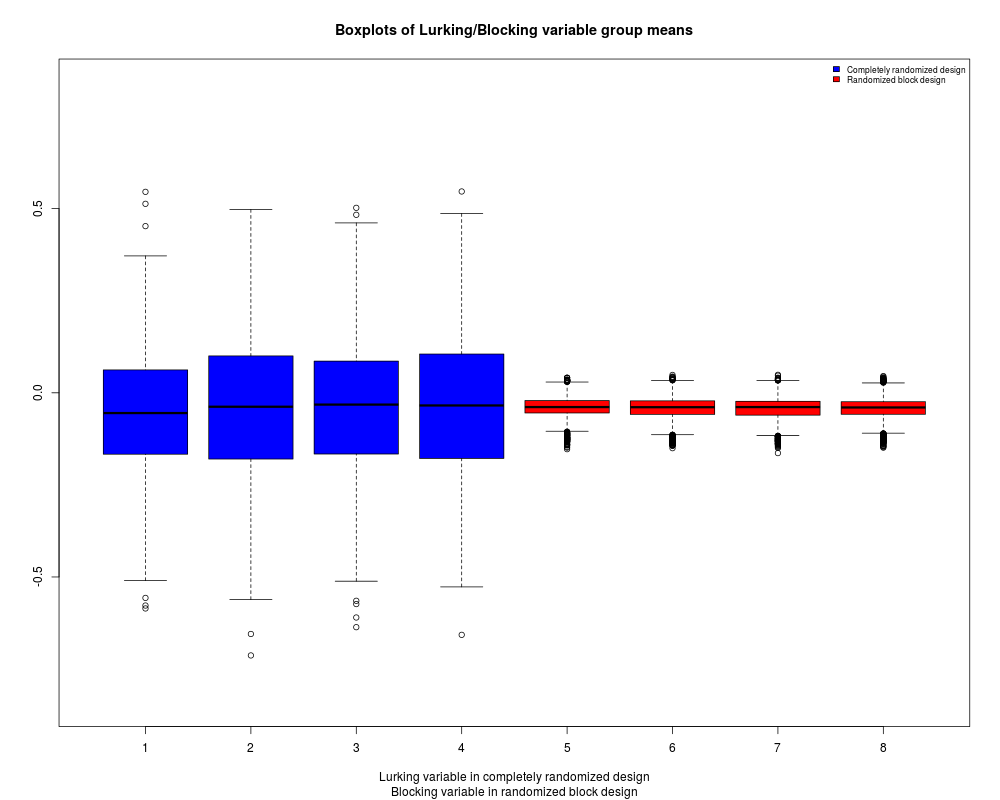
block.means
a vector of the
means of the lurking variable from each replicate of the simulation stored
by treatment number within replicate number
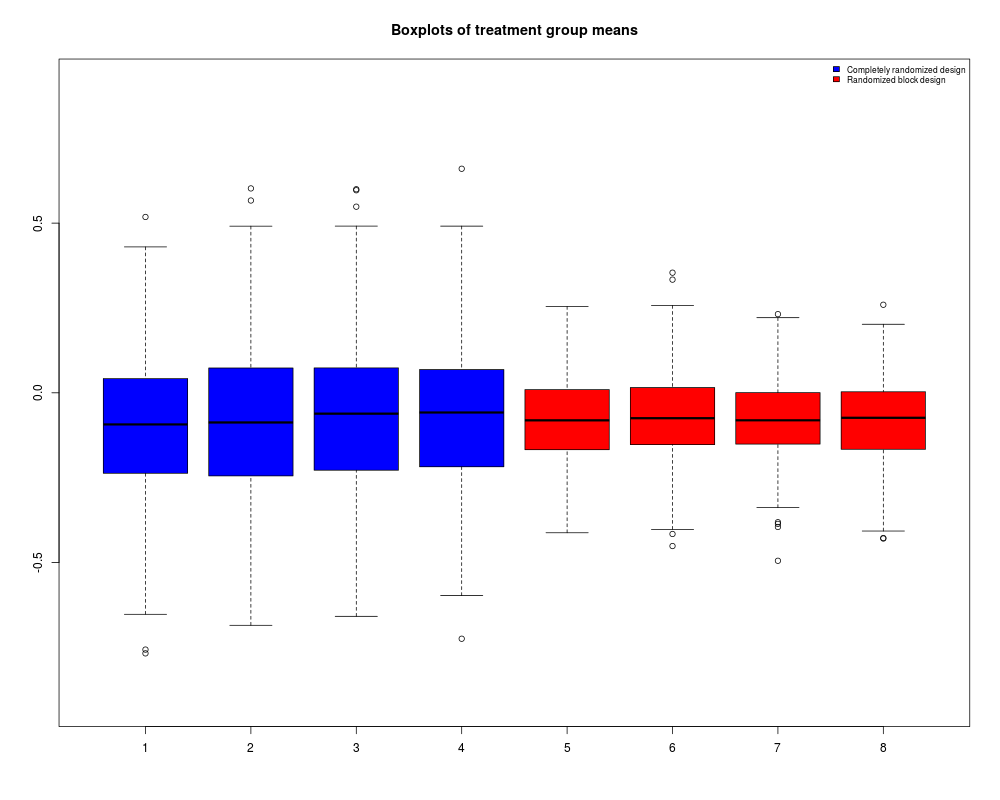
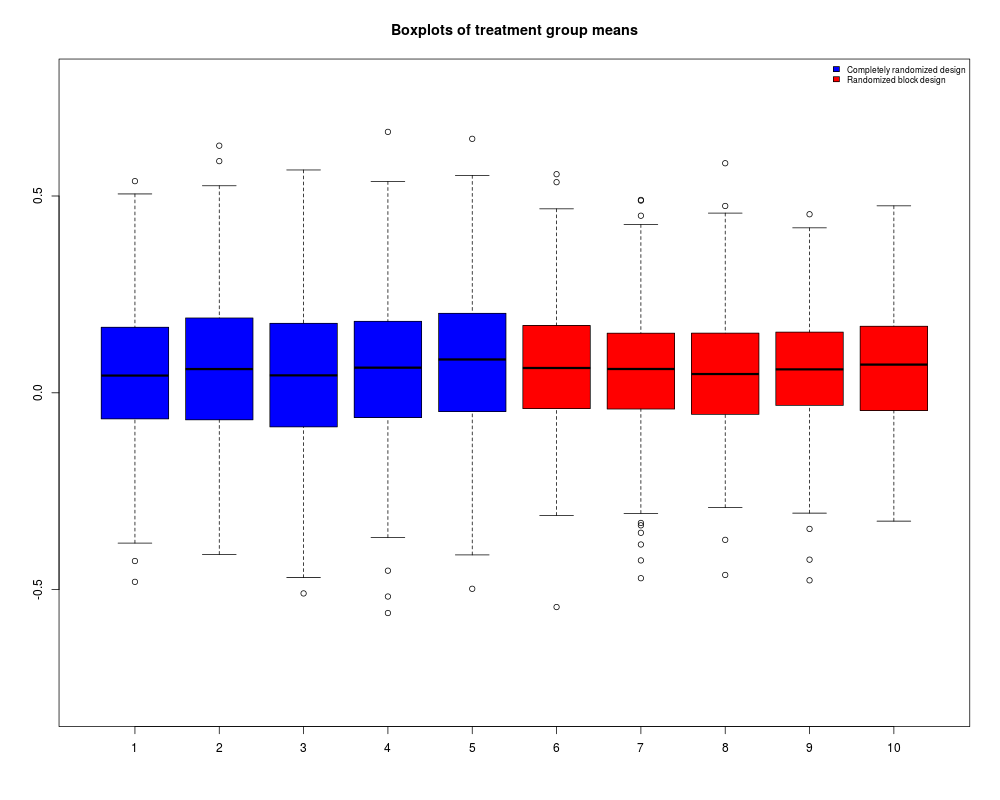
treat.means
a vector of
the means of the response variable from each replicate of the simulation
stored by treatment number within replicate number
ind
a vector
containing the treatment group numbers. Note that there will be twice as
many group numbers as there are treatments corresponding to the simulations
done using a completely randomized design and the simulations done using a
randomized block design
Examples
# Carry out simulations using the default parameters

xdesign()

# Carry out simulations using a simulated response with 5 treaments,
# groups of size 25, and a correlation of -0.6 between the response
# and lurking variable

xdesign(corr = -0.6, size = 25, n.treatments = 5)
Results
R version 3.3.1 (2016-06-21) -- "Bug in Your Hair"
Copyright (C) 2016 The R Foundation for Statistical Computing
Platform: x86_64-pc-linux-gnu (64-bit)
R is free software and comes with ABSOLUTELY NO WARRANTY.
You are welcome to redistribute it under certain conditions.
Type 'license()' or 'licence()' for distribution details.
R is a collaborative project with many contributors.
Type 'contributors()' for more information and
'citation()' on how to cite R or R packages in publications.
Type 'demo()' for some demos, 'help()' for on-line help, or
'help.start()' for an HTML browser interface to help.
Type 'q()' to quit R.
> library(Bolstad)
Attaching package: 'Bolstad'
The following objects are masked from 'package:stats':
IQR, sd, var
> png(filename="/home/ddbj/snapshot/RGM3/R_CC/result/Bolstad/xdesign.Rd_%03d_medium.png", width=480, height=480)
> ### Name: xdesign
> ### Title: Monte Carlo study of randomized and blocked designs
> ### Aliases: xdesign
> ### Keywords: misc
>
> ### ** Examples
>
>
> # Carry out simulations using the default parameters
>
> xdesign()
Variable N Mean Median TrMean StDev SE Mean
X 80 -0.119 -0.086 -0.106 1.138 0.127
Y 80 -0.132 -0.035 -0.116 1.119 0.125
Variable Minimum Maximum Q1 Q3
X -2.831 2.528 -0.893 0.734
Y -2.373 2.457 -1.012 0.784
The Pearson correlation between X and Y is: 0.838
Variable N Mean Median TrMean StDev SE Mean
Randomized 2000 -0.132 -0.128 -0.131 0.215 0.005
Blocked 2000 -0.132 -0.137 -0.133 0.117 0.003
Variable Minimum Maximum Q1 Q3
Randomized -0.922 0.633 -0.279 0.013
Blocked -0.48 0.247 -0.216 -0.053
>
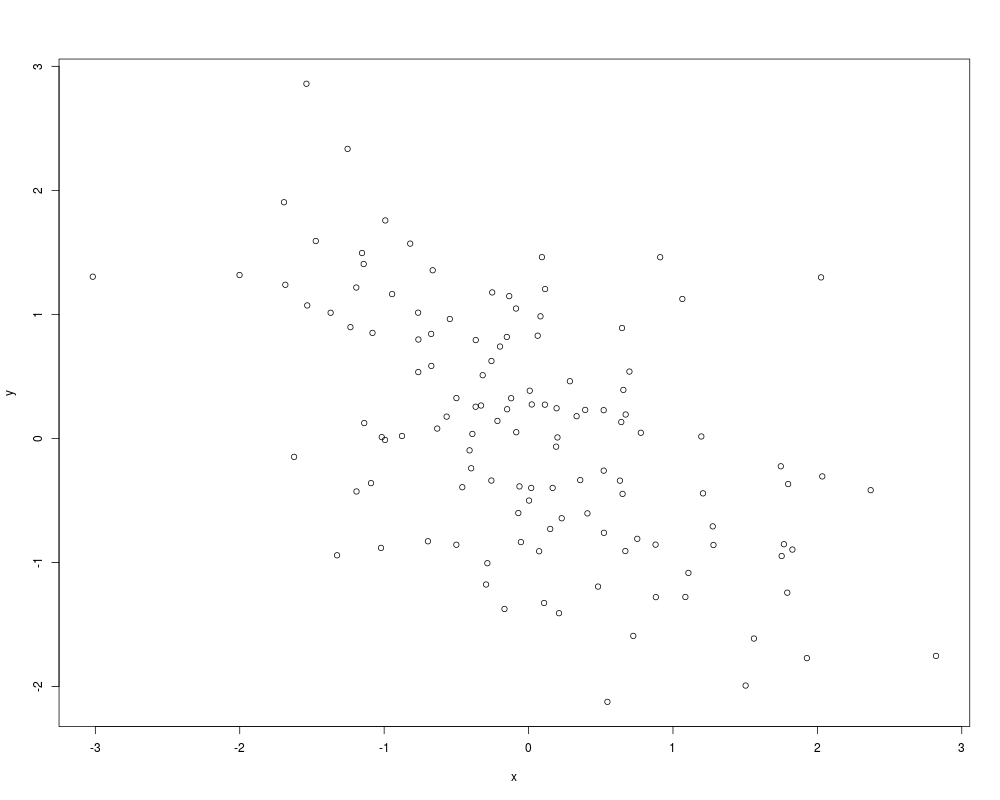
> # Carry out simulations using a simulated response with 5 treaments,
> # groups of size 25, and a correlation of -0.6 between the response
> # and lurking variable
>
> xdesign(corr = -0.6, size = 25, n.treatments = 5)
Variable N Mean Median TrMean StDev SE Mean
X 125 0.006 -0.002 0.021 0.86 0.077
Y 125 -0.004 0.013 0 0.98 0.088
Variable Minimum Maximum Q1 Q3
X -2.944 2.42 -0.482 0.586
Y -3.203 2.377 -0.657 0.693
The Pearson correlation between X and Y is: -0.473
Variable N Mean Median TrMean StDev SE Mean
Randomized 2500 -0.004 -0.003 -0.004 0.175 0.003
Blocked 2500 -0.004 0.001 -0.002 0.157 0.003
Variable Minimum Maximum Q1 Q3
Randomized -0.564 0.589 -0.125 0.114
Blocked -0.532 0.448 -0.105 0.103
>
>
>
>
>
>
> dev.off()
null device
1
>
 .
.