Supported by Dr. Osamu Ogasawara and  . . |
|
Last data update: 2014.03.03 |
Plot CN profiles corrected for cellularityDescriptionThis function takes the result of a call to UsageplotCorrectedCN(CN, chr=NULL) Arguments
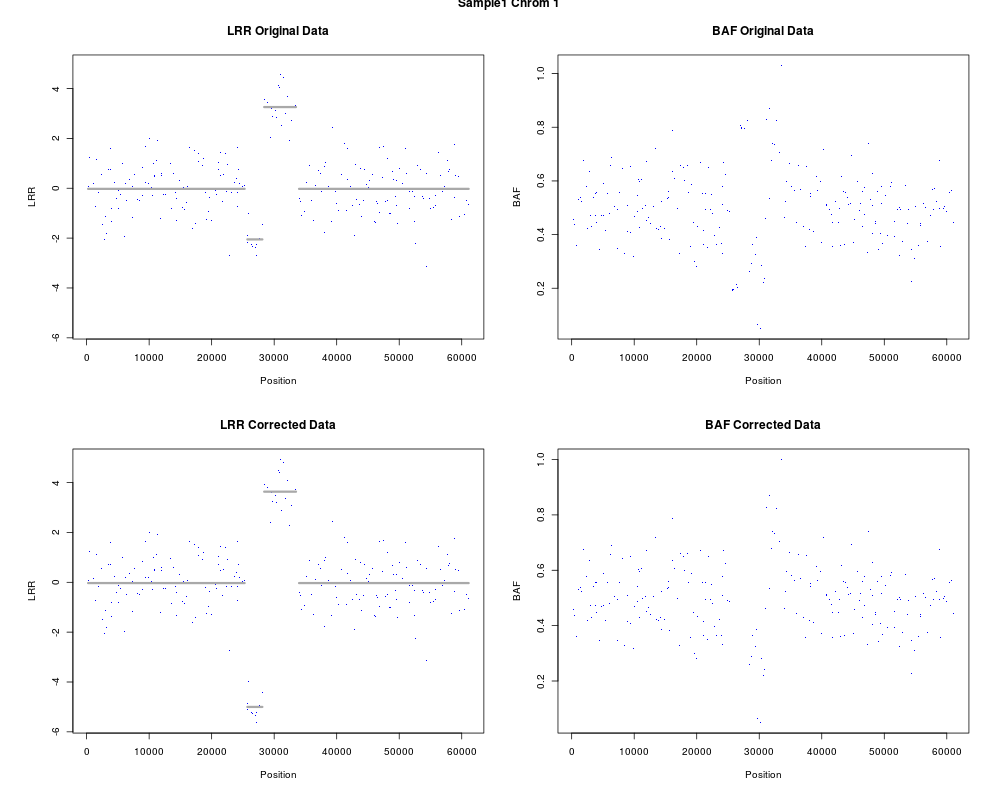
DetailsA panel with four plots is created. The top panel shows LRR (with DNAcopy segmentation overlayed) and BAF before correction and the bottom panel shows the plots after correction. ValueNo value is returned. Author(s)Oscar M. Rueda, rueda.om@gmail.com ReferencesYuan, Y et al. Quantitative image analysis of cellular heterogeneity in primary breast tumors enriches genomic assays. In prep. Examples
LRR <- c(rnorm(100, 0, 1), rnorm(10, -2, 1), rnorm(20, 3, 1),
       rnorm(100,0, 1))
BAF <- c(rnorm(100, 0.5, 0.1), rnorm(5, 0.2, 0.01), rnorm(5, 0.8, 0.01), rnorm(10, 0.25, 0.1), rnorm(10, 0.75, 0.1),
       rnorm(100,0.5, 0.1))

Pos <- sample(x=1:500, size=230, replace=TRUE)
Pos <- cumsum(Pos)
Chrom <- rep(1, length(LRR))
z <- data.frame(Name=1:length(LRR), Chrom=Chrom, Pos=Pos, LRR=LRR, BAF=BAF)
res <- correctCopyNumber(arr="Sample1", chr=1, p=0.75, z=z)
plotCorrectedCN(res, chr=1)
Results
R version 3.3.1 (2016-06-21) -- "Bug in Your Hair"
Copyright (C) 2016 The R Foundation for Statistical Computing
Platform: x86_64-pc-linux-gnu (64-bit)

R is free software and comes with ABSOLUTELY NO WARRANTY.
You are welcome to redistribute it under certain conditions.
Type 'license()' or 'licence()' for distribution details.

R is a collaborative project with many contributors.
Type 'contributors()' for more information and
'citation()' on how to cite R or R packages in publications.

Type 'demo()' for some demos, 'help()' for on-line help, or
'help.start()' for an HTML browser interface to help.
Type 'q()' to quit R.

> library(CRImage)
Loading required package: EBImage
Loading required package: DNAcopy
Loading required package: aCGH
Loading required package: cluster
Loading required package: survival
Loading required package: multtest
Loading required package: BiocGenerics
Loading required package: parallel

Attaching package: 'BiocGenerics'

The following objects are masked from 'package:parallel':

    clusterApply, clusterApplyLB, clusterCall, clusterEvalQ,
    clusterExport, clusterMap, parApply, parCapply, parLapply,
    parLapplyLB, parRapply, parSapply, parSapplyLB

The following objects are masked from 'package:stats':

    IQR, mad, xtabs

The following objects are masked from 'package:base':

    Filter, Find, Map, Position, Reduce, anyDuplicated, append,
    as.data.frame, cbind, colnames, do.call, duplicated, eval, evalq,
    get, grep, grepl, intersect, is.unsorted, lapply, lengths, mapply,
    match, mget, order, paste, pmax, pmax.int, pmin, pmin.int, rank,
    rbind, rownames, sapply, setdiff, sort, table, tapply, union,
    unique, unsplit

Loading required package: Biobase
Welcome to Bioconductor

    Vignettes contain introductory material; view with
    'browseVignettes()'. To cite Bioconductor, see
    'citation("Biobase")', and for packages 'citation("pkgname")'.


Attaching package: 'Biobase'

The following object is masked from 'package:EBImage':

    channel


Attaching package: 'aCGH'

The following object is masked from 'package:stats':

    heatmap

> png(filename="/home/ddbj/snapshot/RGM3/R_BC/result/CRImage/plotCorrectedCN.Rd_%03d_medium.png", width=480, height=480)
> ### Name: plotCorrectedCN
> ### Title: Plot CN profiles corrected for cellularity
> ### Aliases: plotCorrectedCN
> ### Keywords: misc
>
> ### ** Examples
>
> LRR <- c(rnorm(100, 0, 1), rnorm(10, -2, 1), rnorm(20, 3, 1),
+        rnorm(100,0, 1))
> BAF <- c(rnorm(100, 0.5, 0.1), rnorm(5, 0.2, 0.01), rnorm(5, 0.8, 0.01), rnorm(10, 0.25, 0.1), rnorm(10, 0.75, 0.1),
+        rnorm(100,0.5, 0.1))
>
> Pos <- sample(x=1:500, size=230, replace=TRUE)
> Pos <- cumsum(Pos)
> Chrom <- rep(1, length(LRR))
> z <- data.frame(Name=1:length(LRR), Chrom=Chrom, Pos=Pos, LRR=LRR, BAF=BAF)
> res <- correctCopyNumber(arr="Sample1", chr=1, p=0.75, z=z)

...Segmenting Sample...
Analyzing: Sample1

...Estimating BAF...

...Correcting for cellularity...
> plotCorrectedCN(res, chr=1)
>
>
>
>
>
>
> dev.off()
null device
          1
>
|
Created & Maintained by Osamu Ogasawara (osamu.ogasawara@gmail.com) and 