Supported by Dr. Osamu Ogasawara and  . . |
|
Last data update: 2014.03.03 |
Confounder PlotDescriptionPlots similarities of all variables to an outcome variable against similarities of all variables to a predictor of interest UsageconfounderPlot(data, S, x, y, labels, returnS = FALSE, plotLegend = TRUE, col, pch, font, xlim, ylim, ...) Arguments
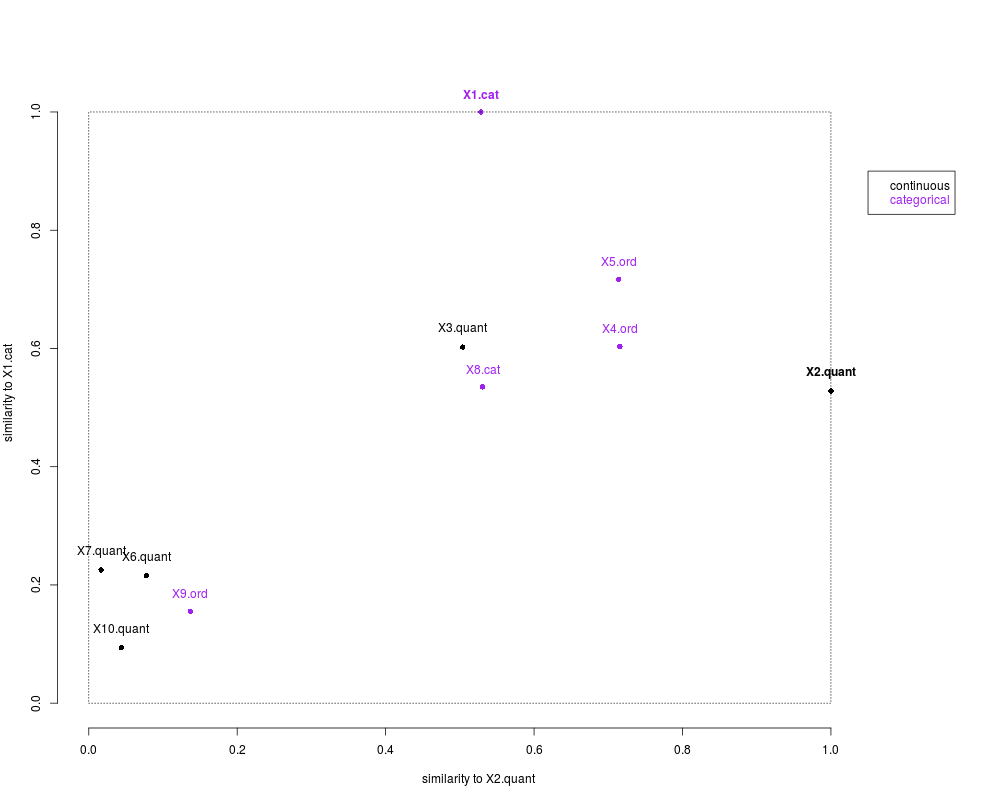
DetailsThe similarities of all variables in a dataset with two variables of special interest (i.e. predictor and outcome of a regression model) are simultaneously visualized in a scatter plot, where the x-axis shows similarities to the predictor and the y-axis similarities to the outcome. The height of the predictor variable's point indicates its association with the outcome and hence its predicting ability. Variables in the upper right part are potential confounders for which prediction model should be adjusted, or collinear variables that should be removed. Variables in the lower right part are strongly related to the predictor, but not associated with the outcome. Variables very close to the outcome variable's point are potential surrogate outcomes. ValueScatterplot of variable similarities. Chosen predictor and outcome variables are highlighted in bold. Categorical/quantitative variables are shown in blue/black by default. Author(s)Manuela Hummel See Also
Examplesdata(mixdata) confounderPlot(mixdata, x="X2.quant", y="X1.cat") Results
R version 3.3.1 (2016-06-21) -- "Bug in Your Hair"
Copyright (C) 2016 The R Foundation for Statistical Computing
Platform: x86_64-pc-linux-gnu (64-bit)

R is free software and comes with ABSOLUTELY NO WARRANTY.
You are welcome to redistribute it under certain conditions.
Type 'license()' or 'licence()' for distribution details.

R is a collaborative project with many contributors.
Type 'contributors()' for more information and
'citation()' on how to cite R or R packages in publications.

Type 'demo()' for some demos, 'help()' for on-line help, or
'help.start()' for an HTML browser interface to help.
Type 'q()' to quit R.

> library(CluMix)
> png(filename="/home/ddbj/snapshot/RGM3/R_CC/result/CluMix/confounderPlot.Rd_%03d_medium.png", width=480, height=480)
> ### Name: confounderPlot
> ### Title: Confounder Plot
> ### Aliases: confounderPlot
> ### Keywords: hplot
>
> ### ** Examples
>
> data(mixdata)
>
> confounderPlot(mixdata, x="X2.quant", y="X1.cat")
>
>
>
>
>
> dev.off()
null device
          1
>
|