number of times the clustering is to be applied to find the best clustering result.
user.maxK
user defined optimal k value for generating optimal clustering. If not provided, the optimal k that is identified by clue will be used.
visualize
a boolean parameter indicating whether to visualize the clustering results.
...
pass additional parameter for controlling the plot if visualize is TRUE.
Value
return a list containing optimal clustering object and enriched kinases or gene sets.
Examples
# simulate a time-series data with 4 distinctive profile groups and each group with
# a size of 50 phosphorylation sites.
simuData <- temporalSimu(seed=1, groupSize=50, sdd=1, numGroups=4)
# create an artificial annotation database. Generate 20 kinase-substrate groups each
# comprising 10 substrates assigned to a kinase.
# among them, create 4 groups each contains phosphorylation sites defined to have the
# same temporal profile.
kinaseAnno <- list()
groupSize <- 50
for (i in 1:4) {
kinaseAnno[[i]] <- paste("p", (groupSize*(i-1)+1):(groupSize*(i-1)+10), sep="_")
}
for (i in 5:20) {
set.seed(i)
kinaseAnno[[i]] <- paste("p", sample.int(nrow(simuData), size = 10), sep="_")
}
names(kinaseAnno) <- paste("KS", 1:20, sep="_")
# run CLUE with a repeat of 2 times and a range from 2 to 7
set.seed(1)
clueObj <- runClue(Tc=simuData, annotation=kinaseAnno, rep=5, kRange=7)
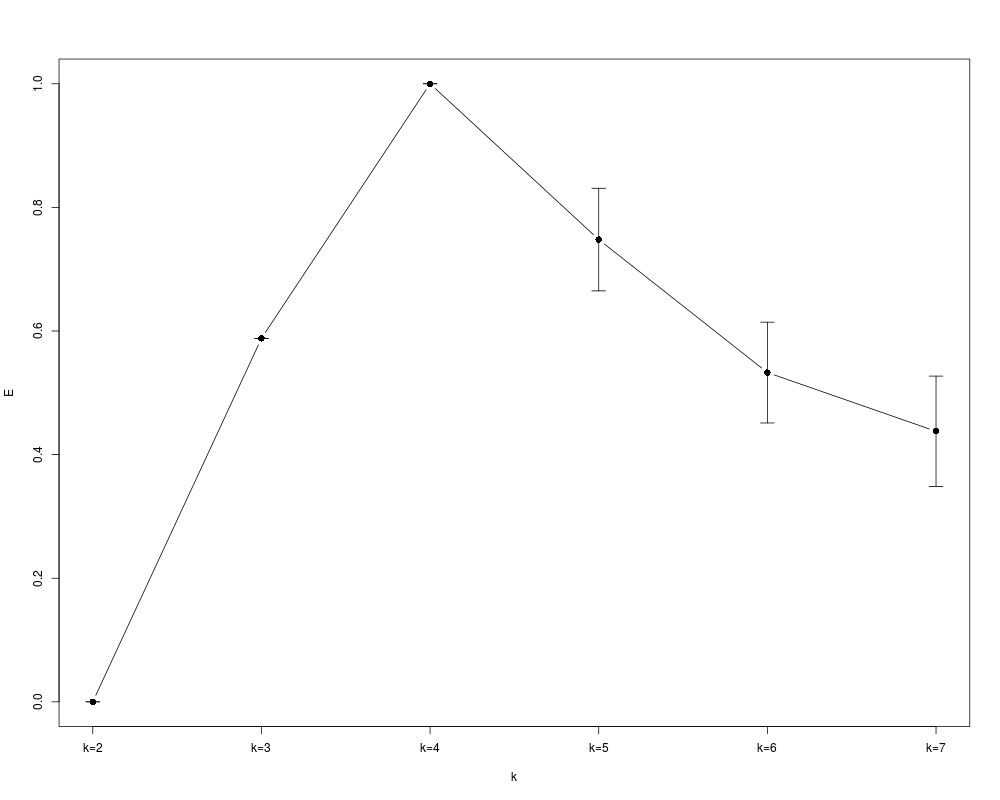
# visualize the evaluation outcome
Ms <- apply(clueObj$evlMat, 2, mean, na.rm=TRUE)
Ss <- apply(clueObj$evlMat, 2, sd, na.rm=TRUE)
library(Hmisc)
errbar(1:length(Ms), Ms, Ms+Ss, Ms-Ss, cex=1.2, type="b", xaxt="n", xlab="k", ylab="E")
axis(1, at=1:6, labels=paste("k=", 2:7, sep=""))
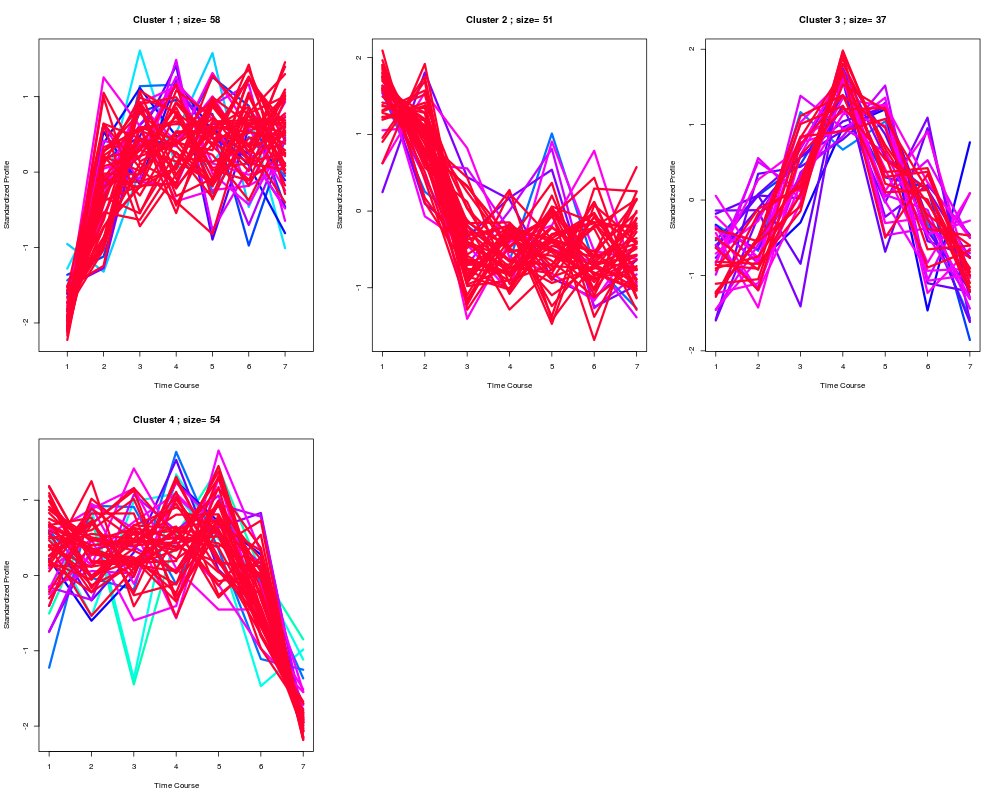
# generate optimal clustering results using the optimal k determined by CLUE
best <- clustOptimal(clueObj, rep=3, mfrow=c(2, 3))
# list enriched clusters
best$enrichList
# obtain the optimal clustering object (not run)
# best$clustObj
Results
R version 3.3.1 (2016-06-21) -- "Bug in Your Hair"
Copyright (C) 2016 The R Foundation for Statistical Computing
Platform: x86_64-pc-linux-gnu (64-bit)

R is free software and comes with ABSOLUTELY NO WARRANTY.
You are welcome to redistribute it under certain conditions.
Type 'license()' or 'licence()' for distribution details.

R is a collaborative project with many contributors.
Type 'contributors()' for more information and
'citation()' on how to cite R or R packages in publications.

Type 'demo()' for some demos, 'help()' for on-line help, or
'help.start()' for an HTML browser interface to help.
Type 'q()' to quit R.

> library(ClueR)
Loading required package: e1071
> png(filename="/home/ddbj/snapshot/RGM3/R_CC/result/ClueR/clustOptimal.Rd_%03d_medium.png", width=480, height=480)
> ### Name: clustOptimal
> ### Title: Generate optimal clustering
> ### Aliases: clustOptimal
>
> ### ** Examples
>
> # simulate a time-series data with 4 distinctive profile groups and each group with
> # a size of 50 phosphorylation sites.
> simuData <- temporalSimu(seed=1, groupSize=50, sdd=1, numGroups=4)
>
> # create an artificial annotation database. Generate 20 kinase-substrate groups each
> # comprising 10 substrates assigned to a kinase.
> # among them, create 4 groups each contains phosphorylation sites defined to have the
> # same temporal profile.
> kinaseAnno <- list()
> groupSize <- 50
> for (i in 1:4) {
+  kinaseAnno[[i]] <- paste("p", (groupSize*(i-1)+1):(groupSize*(i-1)+10), sep="_")
+ }
>
> for (i in 5:20) {
+  set.seed(i)
+  kinaseAnno[[i]] <- paste("p", sample.int(nrow(simuData), size = 10), sep="_")
+ }
> names(kinaseAnno) <- paste("KS", 1:20, sep="_")
>
> # run CLUE with a repeat of 2 times and a range from 2 to 7
> set.seed(1)
> clueObj <- runClue(Tc=simuData, annotation=kinaseAnno, rep=5, kRange=7)
repeat 1
repeat 2
repeat 3
repeat 4
repeat 5
>
> # visualize the evaluation outcome
> Ms <- apply(clueObj$evlMat, 2, mean, na.rm=TRUE)
> Ss <- apply(clueObj$evlMat, 2, sd, na.rm=TRUE)
> library(Hmisc)
Loading required package: lattice
Loading required package: survival
Loading required package: Formula
Loading required package: ggplot2

Attaching package: 'Hmisc'

The following object is masked from 'package:e1071':

    impute

The following objects are masked from 'package:base':

    format.pval, round.POSIXt, trunc.POSIXt, units

> errbar(1:length(Ms), Ms, Ms+Ss, Ms-Ss, cex=1.2, type="b", xaxt="n", xlab="k", ylab="E")
> axis(1, at=1:6, labels=paste("k=", 2:7, sep=""))
>
> # generate optimal clustering results using the optimal k determined by CLUE
> best <- clustOptimal(clueObj, rep=3, mfrow=c(2, 3))
>
> # list enriched clusters
> best$enrichList
$`cluster 1`
     kinase  pvalue                 size
[1,] "KS_1"  "2.32414913991406e-06" "10"
[2,] "KS_12" "0.0364491355691728"   "6"
     substrates
[1,] "p_1|p_2|p_3|p_4|p_5|p_6|p_7|p_8|p_9|p_10"
[2,] "p_2|p_5|p_7|p_14|p_34|p_35"

$`cluster 2`
     kinase pvalue                 size
[1,] "KS_4" "5.69137651667111e-07" "10"
     substrates
[1,] "p_151|p_152|p_153|p_154|p_155|p_156|p_157|p_158|p_159|p_160"

$`cluster 3`
     kinase  pvalue                 size substrates
[1,] "KS_2"  "0.000348551790215745" "7"  "p_51|p_52|p_53|p_54|p_55|p_57|p_58"
[2,] "KS_14" "0.0207823584031702"   "5"  "p_51|p_73|p_83|p_94|p_100"

$`cluster 4`
     kinase pvalue                 size
[1,] "KS_3" "3.56487129089672e-05" "9"
     substrates
[1,] "p_101|p_102|p_103|p_105|p_106|p_107|p_108|p_109|p_110"

>
> # obtain the optimal clustering object (not run)
> # best$clustObj
>
>
>
>
>
> dev.off()
null device
          1
>
 .
.