R: Produce a TSS plot of the two conditions in the data
plotProfiles
R Documentation
Produce a TSS plot of the two conditions in the data
Description
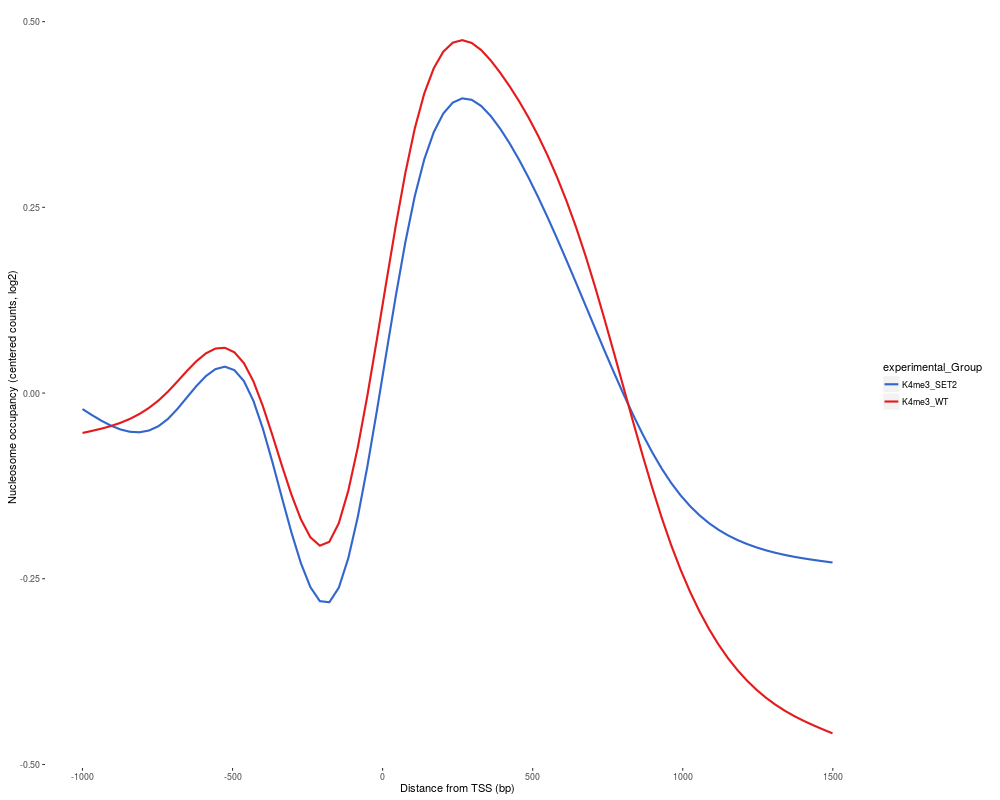
This function plots the positionwise mean of the log2 of the normalized
counts of the two conditions
after runTesting has been run on a DChIPRepResults
object.
R version 3.3.1 (2016-06-21) -- "Bug in Your Hair"
Copyright (C) 2016 The R Foundation for Statistical Computing
Platform: x86_64-pc-linux-gnu (64-bit)

R is free software and comes with ABSOLUTELY NO WARRANTY.
You are welcome to redistribute it under certain conditions.
Type 'license()' or 'licence()' for distribution details.

R is a collaborative project with many contributors.
Type 'contributors()' for more information and
'citation()' on how to cite R or R packages in publications.

Type 'demo()' for some demos, 'help()' for on-line help, or
'help.start()' for an HTML browser interface to help.
Type 'q()' to quit R.

> library(DChIPRep)
Loading required package: DESeq2
Loading required package: S4Vectors
Loading required package: stats4
Loading required package: BiocGenerics
Loading required package: parallel

Attaching package: 'BiocGenerics'

The following objects are masked from 'package:parallel':

    clusterApply, clusterApplyLB, clusterCall, clusterEvalQ,
    clusterExport, clusterMap, parApply, parCapply, parLapply,
    parLapplyLB, parRapply, parSapply, parSapplyLB

The following objects are masked from 'package:stats':

    IQR, mad, xtabs

The following objects are masked from 'package:base':

    Filter, Find, Map, Position, Reduce, anyDuplicated, append,
    as.data.frame, cbind, colnames, do.call, duplicated, eval, evalq,
    get, grep, grepl, intersect, is.unsorted, lapply, lengths, mapply,
    match, mget, order, paste, pmax, pmax.int, pmin, pmin.int, rank,
    rbind, rownames, sapply, setdiff, sort, table, tapply, union,
    unique, unsplit


Attaching package: 'S4Vectors'

The following objects are masked from 'package:base':

    colMeans, colSums, expand.grid, rowMeans, rowSums

Loading required package: IRanges
Loading required package: GenomicRanges
Loading required package: GenomeInfoDb
Loading required package: SummarizedExperiment
Loading required package: Biobase
Welcome to Bioconductor

    Vignettes contain introductory material; view with
    'browseVignettes()'. To cite Bioconductor, see
    'citation("Biobase")', and for packages 'citation("pkgname")'.


Warning message:
replacing previous import 'ggplot2::Position' by 'BiocGenerics::Position' when loading 'soGGi'
> png(filename="/home/ddbj/snapshot/RGM3/R_BC/result/DChIPRep/plotProfiles.Rd_%03d_medium.png", width=480, height=480)
> ### Name: plotProfiles
> ### Title: Produce a TSS plot of the two conditions in the data
> ### Aliases: plotProfiles plotProfiles,DChIPRepResults-method
>
> ### ** Examples
>
> if (requireNamespace("mgcv", quietly=TRUE)) {
+ data(testData)
+ dcr <- DChIPRepResults(testData)
+ dcr <- runTesting(dcr)
+ plotProfiles(dcr)
+ }
gene-wise dispersion estimates
mean-dispersion relationship
final dispersion estimates
Step 1... determine cutoff point
Step 2... estimate parameters of null distribution and eta0
Step 3... compute p-values and estimate empirical PDF/CDF
Step 4... compute q-values and local fdr

>
>
>
>
>
> dev.off()
null device
          1
>
 .
.