Supported by Dr. Osamu Ogasawara and  . . |
|
Last data update: 2014.03.03 |
Simulate Melting of DNADescriptionThe denaturation of double-stranded DNA occurs over a range of temperatures. Beginning from a helical state, DNA will transition to a random-coil state as temperature is increased. Usage
MeltDNA(myDNAStringSet,
        type = "derivative",
        temps = 50:100,
        ions = 0.2)
Arguments
DetailsWhen designing a high resolution melt (HRM) assay, it is useful to be able to predict the results before performing the experiment. Multi-state models of DNA melting can provide near-qualitative agreement with experimental DNA melt curves obtained with quantitative PCR (qPCR). Denaturation is a highly cooperative process whereby regions of double-stranded DNA tend to melt together. For short sequences (< 100 base pairs) there is typically a single transition from a helical to random-coil state. Longer sequences may exhibit more complex melting behavior with multiple peaks, as domains of the DNA melt at different temperatures. The melting curve represents the average fractional helicity (Theta) at each temperature, and can be used for genotyping with high resolution melt analysis. Value
If Note
Author(s)Erik Wright DECIPHER@cae.wisc.edu ReferencesSantaLucia, J. (1998). A unified view of polymer, dumbbell, and oligonucleotide DNA nearest-neighbor thermodynamics. Proceedings of the National Academy of Sciences, 95(4), 1460-1465. Tostesen, E., et al. (2003). Speed-up of DNA melting algorithm with complete nearest neighbor properties. Biopolymers, 70(3), 364-376. doi:10.1002/bip.10495. See Also
Examples
fas <- system.file("extdata", "IDH2.fas", package="DECIPHER")
dna <- readDNAStringSet(fas)
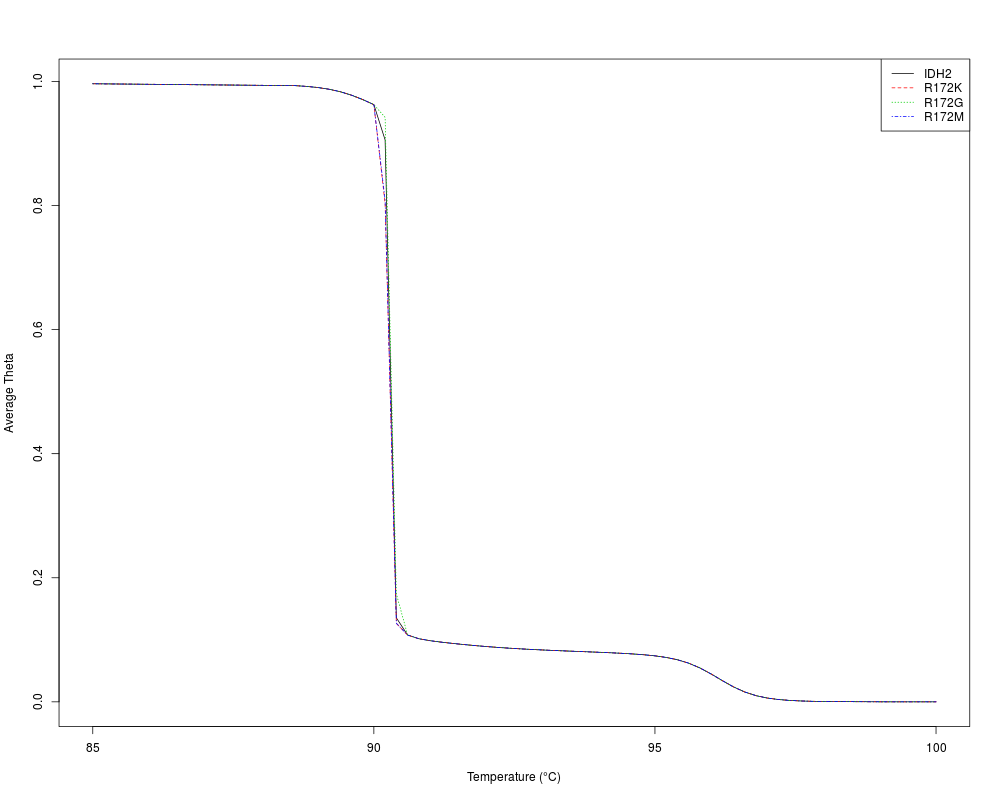
# plot the melt curve for the two alleles
temps <- seq(85, 100, 0.2)
m <- MeltDNA(dna,
type="melt", temps=temps, ions=0.1)
matplot(temps, m,
type="l", xlab="Temperature (u00B0C)", ylab="Average Theta")
legend("topright", names(dna), lty=seq_along(dna), col=seq_along(dna))
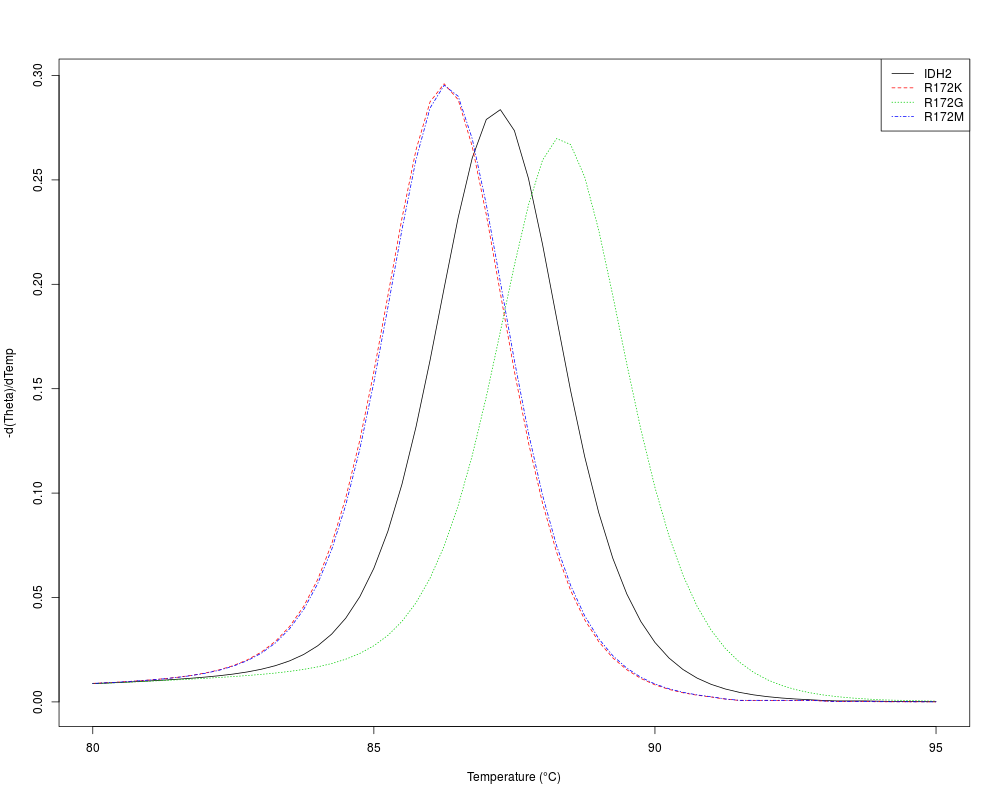
# plot the negative derivative curve for a subsequence of the two alleles
temps <- seq(80, 95, 0.25)
m <- MeltDNA(subseq(dna, 492, 542),
type="derivative", temps=temps)
matplot(temps, m,
type="l", xlab="Temperature (u00B0C)", ylab="-d(Theta)/dTemp")
legend("topright", names(dna), lty=seq_along(dna), col=seq_along(dna))
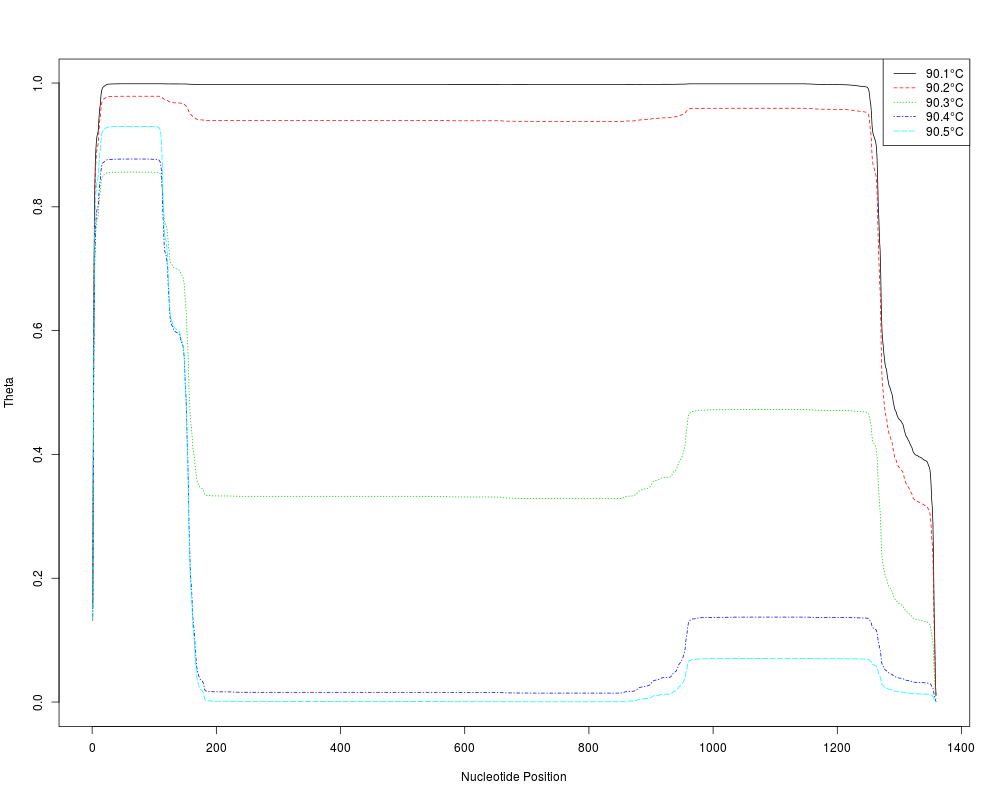
# plot the positional helicity profile for the IDH2 allele
temps <- seq(90.1, 90.5, 0.1)
m <- MeltDNA(dna[1],
type="position", temps=temps, ions=0.1)
matplot(seq_len(dim(m[[1]])[2]), t(m[[1]]),
type="l", xlab="Nucleotide Position", ylab="Theta")
temps <- formatC(temps, digits=1, format="f")
legend("topright", legend=paste(temps, "u00B0C", sep=""),
col=seq_along(temps), lty=seq_along(temps), bg="white")
Results
R version 3.3.1 (2016-06-21) -- "Bug in Your Hair"
Copyright (C) 2016 The R Foundation for Statistical Computing
Platform: x86_64-pc-linux-gnu (64-bit)

R is free software and comes with ABSOLUTELY NO WARRANTY.
You are welcome to redistribute it under certain conditions.
Type 'license()' or 'licence()' for distribution details.

R is a collaborative project with many contributors.
Type 'contributors()' for more information and
'citation()' on how to cite R or R packages in publications.

Type 'demo()' for some demos, 'help()' for on-line help, or
'help.start()' for an HTML browser interface to help.
Type 'q()' to quit R.

> library(DECIPHER)
Loading required package: Biostrings
Loading required package: BiocGenerics
Loading required package: parallel

Attaching package: 'BiocGenerics'

The following objects are masked from 'package:parallel':

    clusterApply, clusterApplyLB, clusterCall, clusterEvalQ,
    clusterExport, clusterMap, parApply, parCapply, parLapply,
    parLapplyLB, parRapply, parSapply, parSapplyLB

The following objects are masked from 'package:stats':

    IQR, mad, xtabs

The following objects are masked from 'package:base':

    Filter, Find, Map, Position, Reduce, anyDuplicated, append,
    as.data.frame, cbind, colnames, do.call, duplicated, eval, evalq,
    get, grep, grepl, intersect, is.unsorted, lapply, lengths, mapply,
    match, mget, order, paste, pmax, pmax.int, pmin, pmin.int, rank,
    rbind, rownames, sapply, setdiff, sort, table, tapply, union,
    unique, unsplit

Loading required package: S4Vectors
Loading required package: stats4

Attaching package: 'S4Vectors'

The following objects are masked from 'package:base':

    colMeans, colSums, expand.grid, rowMeans, rowSums

Loading required package: IRanges
Loading required package: XVector
Loading required package: RSQLite
Loading required package: DBI
> png(filename="/home/ddbj/snapshot/RGM3/R_BC/result/DECIPHER/MeltDNA.Rd_%03d_medium.png", width=480, height=480)
> ### Name: MeltDNA
> ### Title: Simulate Melting of DNA
> ### Aliases: MeltDNA
>
> ### ** Examples
>
> fas <- system.file("extdata", "IDH2.fas", package="DECIPHER")
> dna <- readDNAStringSet(fas)
>
> # plot the melt curve for the two alleles
> temps <- seq(85, 100, 0.2)
> m <- MeltDNA(dna,
+              type="melt", temps=temps, ions=0.1)
> matplot(temps, m,
+         type="l", xlab="Temperature (u00B0C)", ylab="Average Theta")
> legend("topright", names(dna), lty=seq_along(dna), col=seq_along(dna))
>
> # plot the negative derivative curve for a subsequence of the two alleles
> temps <- seq(80, 95, 0.25)
> m <- MeltDNA(subseq(dna, 492, 542),
+              type="derivative", temps=temps)
> matplot(temps, m,
+         type="l", xlab="Temperature (u00B0C)", ylab="-d(Theta)/dTemp")
> legend("topright", names(dna), lty=seq_along(dna), col=seq_along(dna))
>
> # plot the positional helicity profile for the IDH2 allele
> temps <- seq(90.1, 90.5, 0.1)
> m <- MeltDNA(dna[1],
+              type="position", temps=temps, ions=0.1)
> matplot(seq_len(dim(m[[1]])[2]), t(m[[1]]),
+         type="l", xlab="Nucleotide Position", ylab="Theta")
> temps <- formatC(temps, digits=1, format="f")
> legend("topright", legend=paste(temps, "u00B0C", sep=""),
+         col=seq_along(temps), lty=seq_along(temps), bg="white")
>
>
>
>
>
> dev.off()
null device
          1
>
|