Supported by Dr. Osamu Ogasawara and  . . |
|
Last data update: 2014.03.03 |
Synteny blocks and hitsDescriptionSyntenic blocks are DNA segments composed of conserved hits occurring in the same order on two sequences. The two sequences are typically chromosomes of different species that are hypothesized to contain homology. Class Usage
## S3 method for class 'Synteny'
pairs(x,
     bounds = TRUE,
     boxBlocks = FALSE,
     labels = abbreviate(rownames(x), 9),
     gap = 0.5,
     line.main = 3,
     cex.labels = NULL,
     font.labels = 1,
     ...)

## S3 method for class 'Synteny'
plot(x,
     colorBy = 1,
     colorRamp = colorRampPalette(c("#FCF9EE", "#FFF272",
                                    "#FFAC28", "#EC5931",
                                    "#EC354D", "#ECA6B1")),
     barColor = "#CCCCCC",
     barSides = ifelse(nrow(x) < 100, TRUE, FALSE),
     horizontal = TRUE,
     labels = abbreviate(rownames(x), 9),
     cex.labels = NULL,
     width = 0.7,
     ...)

## S3 method for class 'Synteny'
print(x,
      quote = FALSE,
      right = TRUE,
      ...)
Arguments
DetailsObjects of class The The Author(s)Erik Wright DECIPHER@cae.wisc.edu See Also
Examples
# a small example:
dbConn <- dbConnect(SQLite(), ":memory:")
s1 <- DNAStringSet("ACTAGACCCAGACCGATAAACGGACTGGACAAG")
s3 <- reverseComplement(s1)
s2 <- c(s1, s3)
Seqs2DB(c(c(s1, s2), s3),
"XStringSet",
dbConn,
c("s1", "s2", "s2", "s3"))
syn <- FindSynteny(dbConn, minScore=1)
syn # Note: > 100% hits because of sequence reuse across blocks
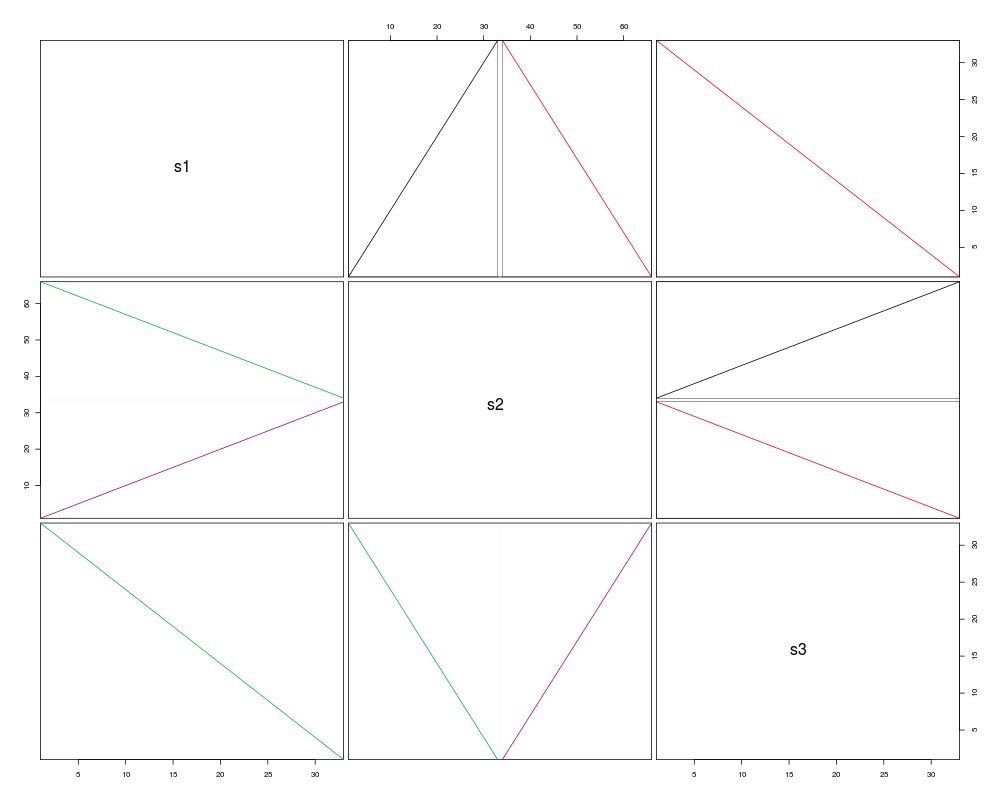
pairs(syn, boxBlocks=TRUE)
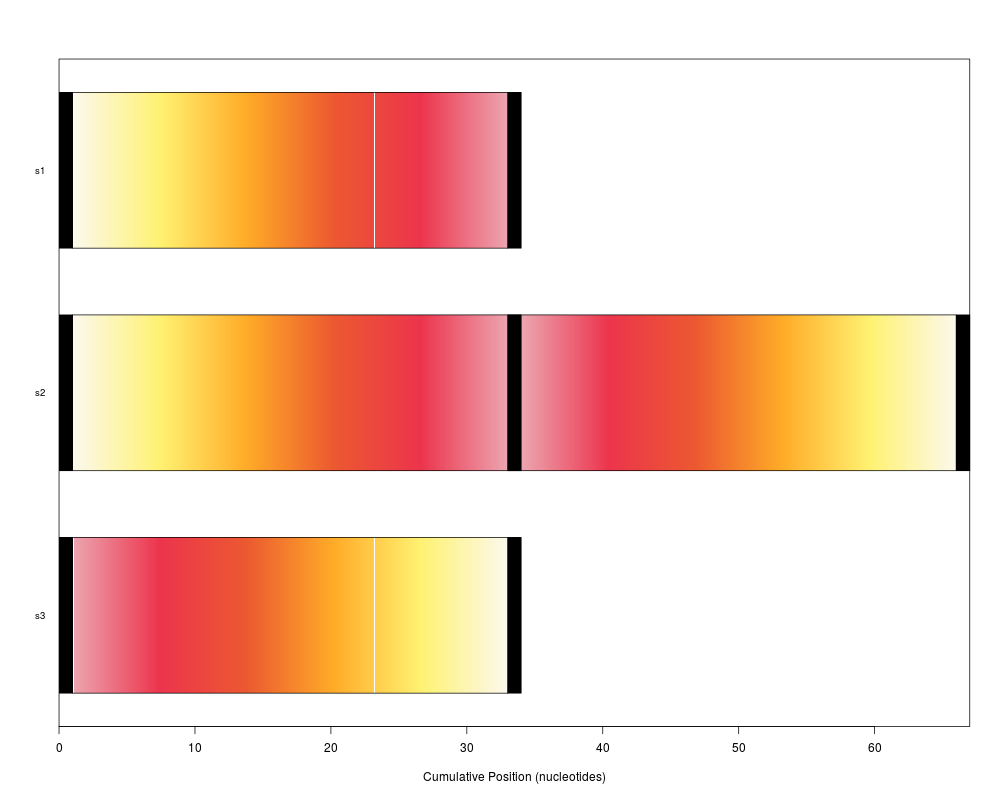
plot(syn)
dbDisconnect(dbConn)
# a larger example:
db <- system.file("extdata", "Influenza.sqlite", package="DECIPHER")
synteny <- FindSynteny(db, minScore=50)
class(synteny) # 'Synteny'
synteny
# accessing parts
i <- 1
j <- 2
synteny[i, i][[1]] # width of sequences in i
synteny[j, j][[1]] # width of sequences in j
head(synteny[i, j][[1]]) # hits between i & j
synteny[j, i][[1]] # blocks between i & j
# plotting
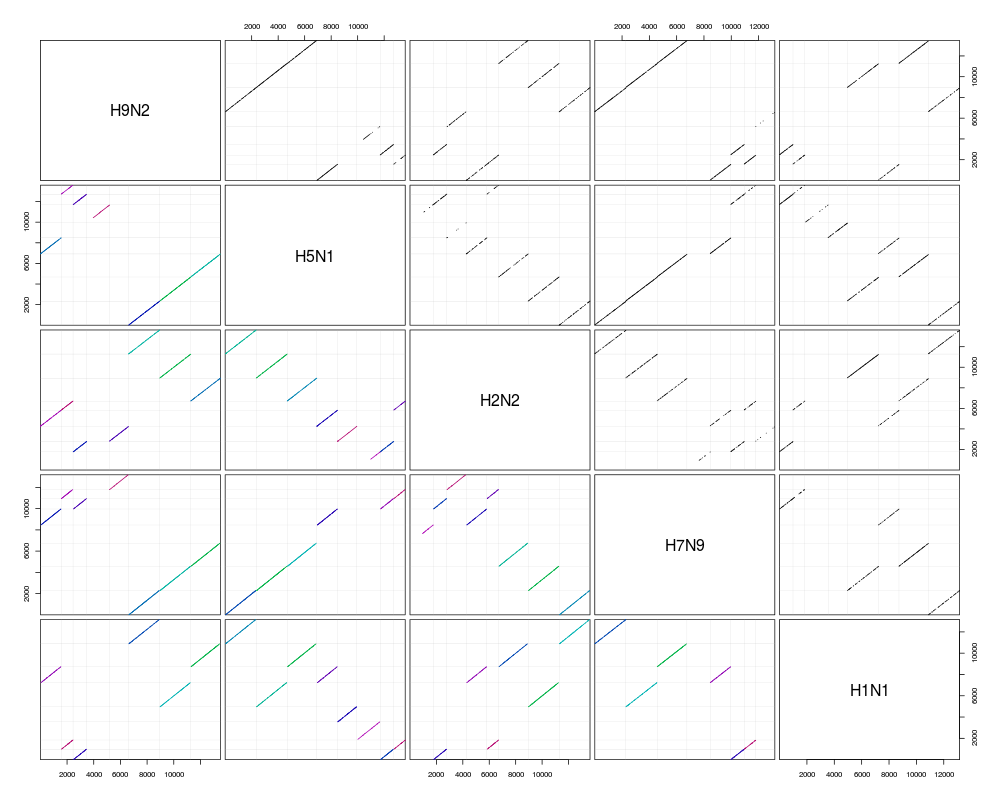
pairs(synteny) # dot plots
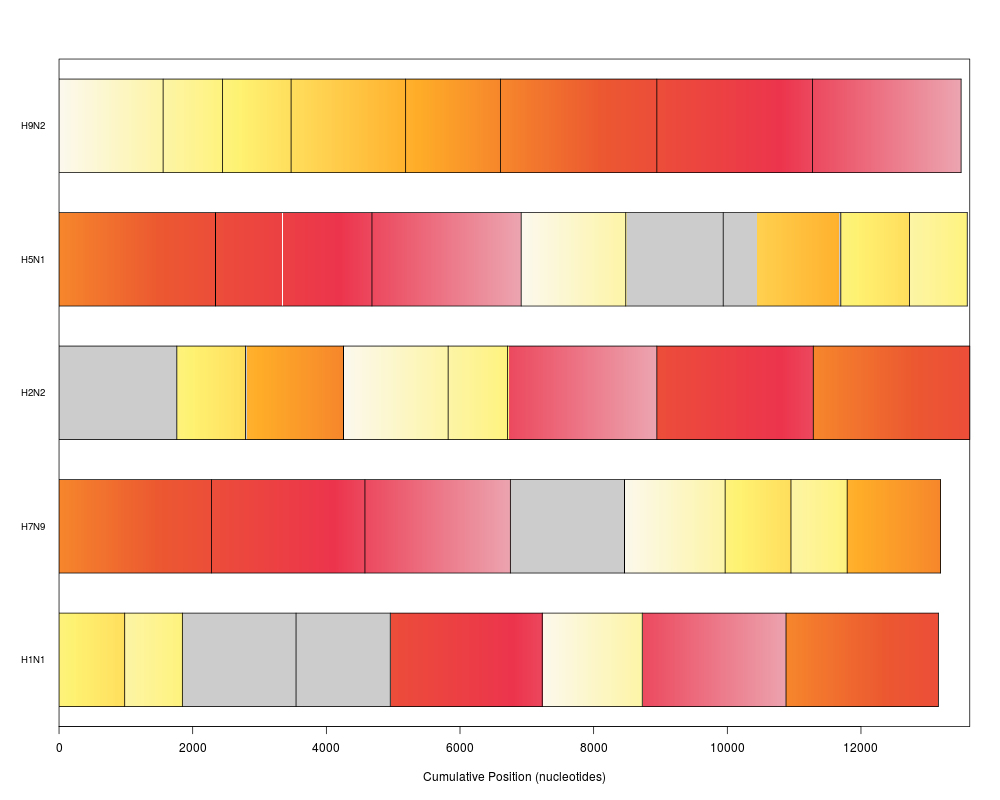
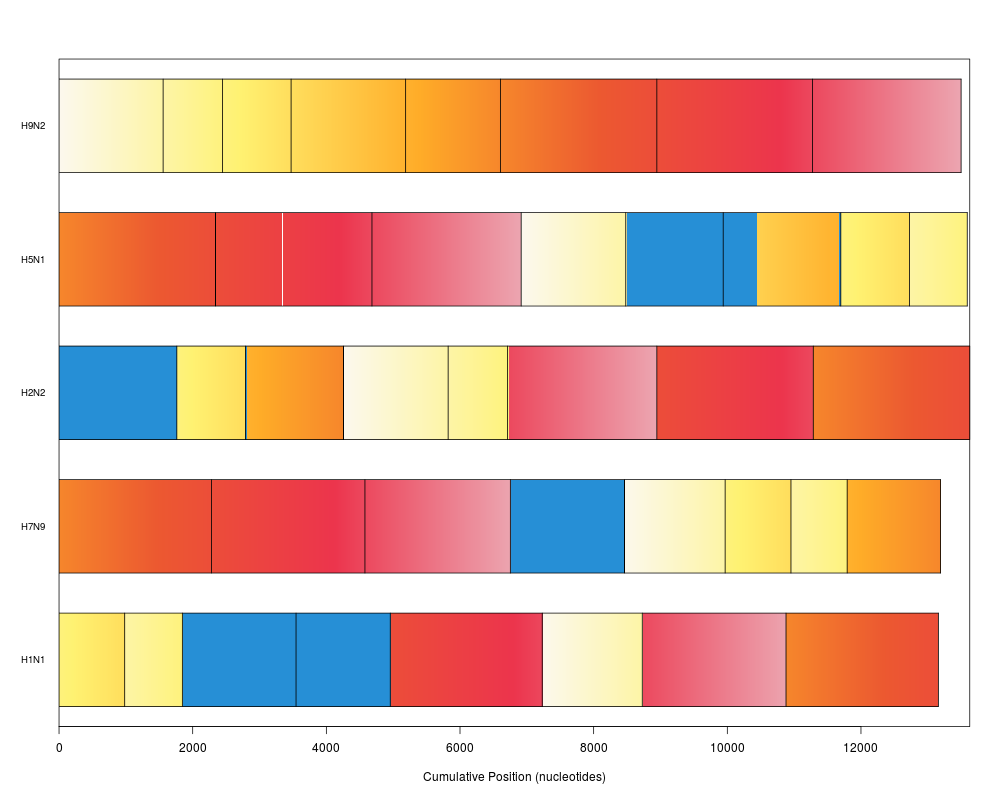
plot(synteny) # bar view colored by position in genome 1
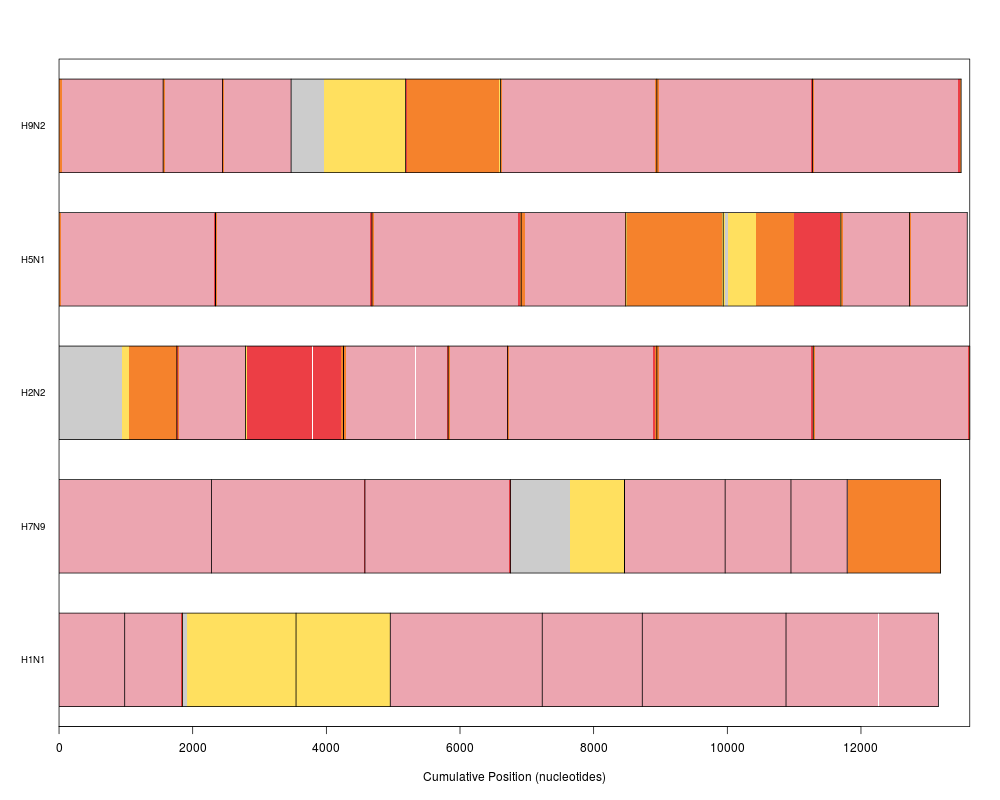
plot(synteny, barColor="#268FD6") # emphasize missing regions
plot(synteny, "frequency") # most regions are shared by all
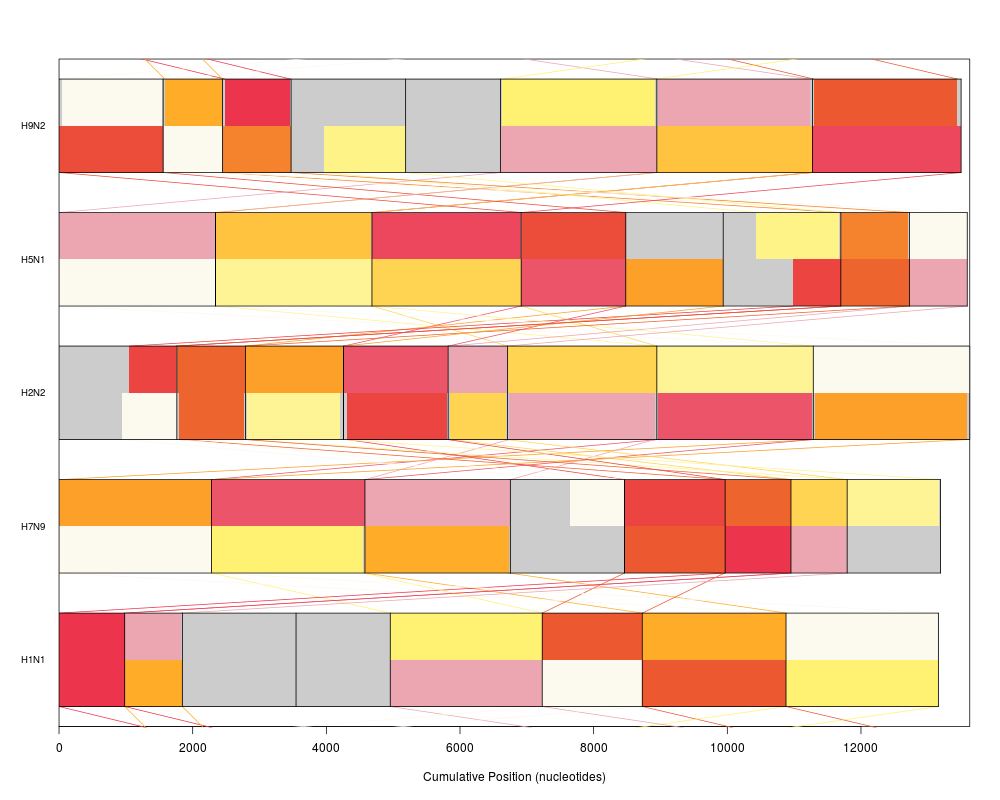
plot(synteny, "neighbor")
Results
R version 3.3.1 (2016-06-21) -- "Bug in Your Hair"
Copyright (C) 2016 The R Foundation for Statistical Computing
Platform: x86_64-pc-linux-gnu (64-bit)

R is free software and comes with ABSOLUTELY NO WARRANTY.
You are welcome to redistribute it under certain conditions.
Type 'license()' or 'licence()' for distribution details.

R is a collaborative project with many contributors.
Type 'contributors()' for more information and
'citation()' on how to cite R or R packages in publications.

Type 'demo()' for some demos, 'help()' for on-line help, or
'help.start()' for an HTML browser interface to help.
Type 'q()' to quit R.

> library(DECIPHER)
Loading required package: Biostrings
Loading required package: BiocGenerics
Loading required package: parallel

Attaching package: 'BiocGenerics'

The following objects are masked from 'package:parallel':

    clusterApply, clusterApplyLB, clusterCall, clusterEvalQ,
    clusterExport, clusterMap, parApply, parCapply, parLapply,
    parLapplyLB, parRapply, parSapply, parSapplyLB

The following objects are masked from 'package:stats':

    IQR, mad, xtabs

The following objects are masked from 'package:base':

    Filter, Find, Map, Position, Reduce, anyDuplicated, append,
    as.data.frame, cbind, colnames, do.call, duplicated, eval, evalq,
    get, grep, grepl, intersect, is.unsorted, lapply, lengths, mapply,
    match, mget, order, paste, pmax, pmax.int, pmin, pmin.int, rank,
    rbind, rownames, sapply, setdiff, sort, table, tapply, union,
    unique, unsplit

Loading required package: S4Vectors
Loading required package: stats4

Attaching package: 'S4Vectors'

The following objects are masked from 'package:base':

    colMeans, colSums, expand.grid, rowMeans, rowSums

Loading required package: IRanges
Loading required package: XVector
Loading required package: RSQLite
Loading required package: DBI
> png(filename="/home/ddbj/snapshot/RGM3/R_BC/result/DECIPHER/Synteny-class.Rd_%03d_medium.png", width=480, height=480)
> ### Name: Synteny
> ### Title: Synteny blocks and hits
> ### Aliases: Synteny-class [.Synteny print.Synteny plot.Synteny
> ###   pairs.Synteny
>
> ### ** Examples
>
> # a small example:
> dbConn <- dbConnect(SQLite(), ":memory:")
> s1 <- DNAStringSet("ACTAGACCCAGACCGATAAACGGACTGGACAAG")
> s3 <- reverseComplement(s1)
> s2 <- c(s1, s3)
> Seqs2DB(c(c(s1, s2), s3),
+         "XStringSet",
+         dbConn,
+         c("s1", "s2", "s2", "s3"))
Adding 4 sequences to the database.

4 total sequences in table Seqs.
Time difference of 0.02 secs

> syn <- FindSynteny(dbConn, minScore=1)
   |                                                                               |                                                                      |   0%   |                                                                               |============                                                          |  17%   |                                                                               |=======================                                               |  33%   |                                                                               |===================================                                   |  50%   |                                                                               |===============================================                       |  67%   |                                                                               |==========================================================            |  83%   |                                                                               |======================================================================| 100%

Time difference of 0.09 secs

> syn # Note:  > 100% hits because of sequence reuse across blocks
         s1        s2        s3
s1    1 seq 200% hits 100% hits
s2 2 blocks    2 seqs 200% hits
s3  1 block  2 blocks     1 seq
> pairs(syn, boxBlocks=TRUE)
> plot(syn)
> dbDisconnect(dbConn)
[1] TRUE
>
> # a larger example:
> db <- system.file("extdata", "Influenza.sqlite", package="DECIPHER")
> synteny <- FindSynteny(db, minScore=50)
   |                                                                               |                                                                      |   0%   |                                                                               |====                                                                  |   5%   |                                                                               |=======                                                               |  10%   |                                                                               |==========                                                            |  15%   |                                                                               |==============                                                        |  20%   |                                                                               |==================                                                    |  25%   |                                                                               |=====================                                                 |  30%   |                                                                               |========================                                              |  35%   |                                                                               |============================                                          |  40%   |                                                                               |================================                                      |  45%   |                                                                               |===================================                                   |  50%   |                                                                               |======================================                                |  55%   |                                                                               |==========================================                            |  60%   |                                                                               |==============================================                        |  65%   |                                                                               |=================================================                     |  70%   |                                                                               |====================================================                  |  75%   |                                                                               |========================================================              |  80%   |                                                                               |============================================================          |  85%   |                                                                               |===============================================================       |  90%   |                                                                               |==================================================================    |  95%   |                                                                               |======================================================================| 100%

Time difference of 0.32 secs

> class(synteny) # 'Synteny'
[1] "Synteny"
> synteny
         H9N2     H5N1     H2N2     H7N9     H1N1
H9N2   8 seqs 53% hits 34% hits 48% hits 34% hits
H5N1 7 blocks   8 seqs 30% hits 47% hits 44% hits
H2N2 7 blocks 8 blocks   8 seqs 29% hits 35% hits
H7N9 7 blocks 6 blocks 8 blocks   8 seqs 32% hits
H1N1 6 blocks 8 blocks 6 blocks 6 blocks   8 seqs
>
> # accessing parts
> i <- 1
> j <- 2
> synteny[i, i][[1]] # width of sequences in i
[1] 1557  890 1025 1714 1418 2341 2328 2225
> synteny[j, j][[1]] # width of sequences in j
[1] 2341 2341 2233 1565 1458 1760 1027  865
> head(synteny[i, j][[1]]) # hits between i & j
     index1 index2 strand width start1 start2 frame1 frame2
[1,]      7      2      0    73      1      2      0      0
[2,]      7      2      0    32     75     76      0      0
[3,]      7      2      0    64    115    116      0      0
[4,]      7      2      0    11    195    196      0      0
[5,]      7      2      0    17    207    208      0      0
[6,]      7      2      0    12    228    229      0      0
> synteny[j, i][[1]] # blocks between i & j
     index1 index2 strand score start1 start2 end1 end2 first_hit last_hit
[1,]      7      2      0  2443      1      2 2328 2329         1       76
[2,]      8      3      0  1776      1      5 2225 2229        77      148
[3,]      1      4      0  1664      1      7 1557 1563       149      190
[4,]      6      1      0  1568      3      3 2341 2341       191      259
[5,]      3      7      0   978     10      3 1018 1011       260      290
[6,]      2      8      0   255     13      1  877  865       291      304
[7,]      4      6      0   192    491    493 1714 1728       305      310
>
> # plotting
> pairs(synteny) # dot plots
>
> plot(synteny) # bar view colored by position in genome 1
> plot(synteny, barColor="#268FD6") # emphasize missing regions
> plot(synteny, "frequency") # most regions are shared by all
> plot(synteny, "neighbor")
>
>
>
>
>
> dev.off()
null device
          1
>
|