Supported by Dr. Osamu Ogasawara and  . . |
|
Last data update: 2014.03.03 |
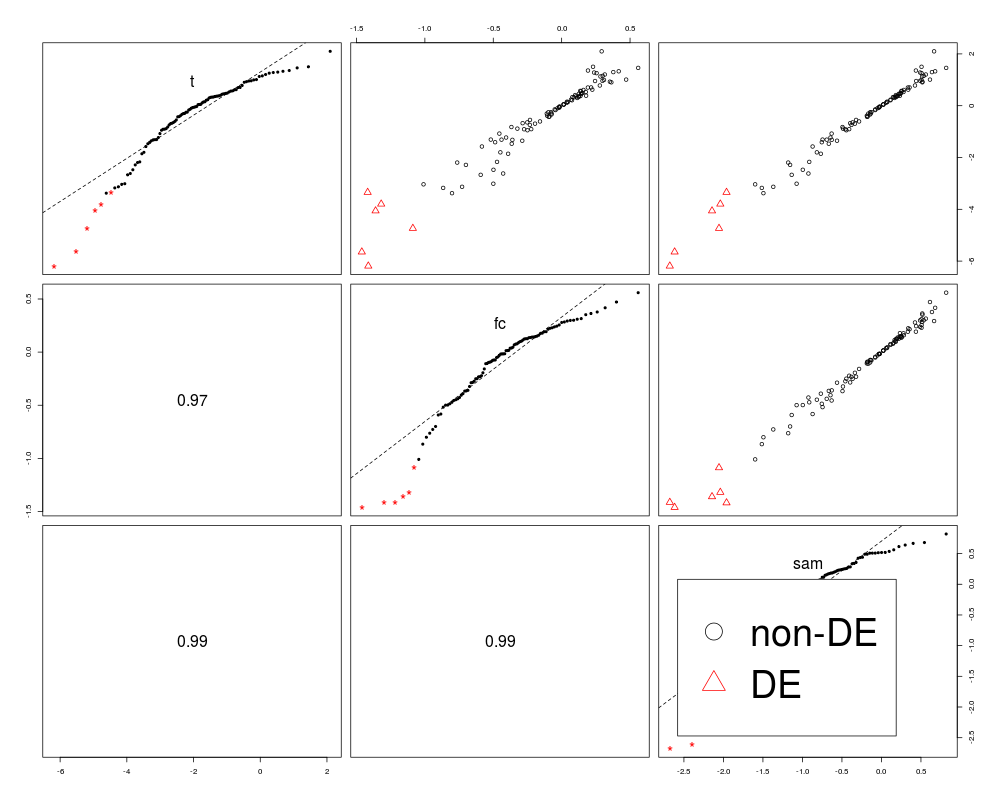
Pairs Plot for DEDS ObjectsDescriptionThe function Usage
## S3 method for class 'DEDS'
pairs(x, subset=c(1:nrow(x$stats)), labels =
colnames(x$stats[,-1]), logit = FALSE,
diagonal = c("qqnorm", "boxplot", "density", "histogram", "none"),
lower = c("cor", "none"), groups.by.deds = TRUE, thresh = 0.05, reg.line
= NULL, smooth = FALSE, line.by.group = FALSE, diag.by.group = TRUE, lower.by.group =
FALSE, col = palette(), pch = 1:n.groups, lwd = 1, legend.plot =
length(levels(groups)) > 1, ...)
Arguments
DetailsThe function
Author(s)Yuanyuan Xiao, yxiao@itsa.ucsf.edu, See Also
ExamplesX <- matrix(rnorm(1000,0,0.5), nc=10) L <- rep(0:1,c(5,5)) # genes 1-10 are differentially expressed X[1:10,6:10]<-X[1:10,6:10]+1 # DEDS d <- deds.stat.linkC(X, L, B=200) # pairs plot pairs(d) # plot regression line pairs(d, reg.line=lm, lwd=2) # histogram in the diagonal panel pairs(d, diagonal="hist") # boxplot on the diagonal panel and stratified pairs(d, diagonal="boxplot", diag.by.group=TRUE) Results
R version 3.3.1 (2016-06-21) -- "Bug in Your Hair"
Copyright (C) 2016 The R Foundation for Statistical Computing
Platform: x86_64-pc-linux-gnu (64-bit)
R is free software and comes with ABSOLUTELY NO WARRANTY.
You are welcome to redistribute it under certain conditions.
Type 'license()' or 'licence()' for distribution details.
R is a collaborative project with many contributors.
Type 'contributors()' for more information and
'citation()' on how to cite R or R packages in publications.
Type 'demo()' for some demos, 'help()' for on-line help, or
'help.start()' for an HTML browser interface to help.
Type 'q()' to quit R.
> library(DEDS)
> png(filename="/home/ddbj/snapshot/RGM3/R_BC/result/DEDS/pairs.DEDS.Rd_%03d_medium.png", width=480, height=480)
> ### Name: pairs-methods
> ### Title: Pairs Plot for DEDS Objects
> ### Aliases: pairs.DEDS pairs pairs-methods
> ### Keywords: hplot
>
> ### ** Examples
>
> X <- matrix(rnorm(1000,0,0.5), nc=10)
> L <- rep(0:1,c(5,5))
>
> # genes 1-10 are differentially expressed
> X[1:10,6:10]<-X[1:10,6:10]+1
> # DEDS
> d <- deds.stat.linkC(X, L, B=200)
We'll do random permutations, B = 200
Two-sample Statistics:
t FC SAM
E of the orginial data is: 5.698 1.736 2.846
b=2 b=4 b=6 b=8 b=10 b=12 b=14 b=16 b=18 b=20
b=22 b=24 b=26 b=28 b=30 b=32 b=34 b=36 b=38 b=40
b=42 b=44 b=46 b=48 b=50 b=52 b=54 b=56 b=58 b=60
b=62 b=64 b=66 b=68 b=70 b=72 b=74 b=76 b=78 b=80
b=82 b=84 b=86 b=88 b=90 b=92 b=94 b=96 b=98 b=100
b=102 b=104 b=106 b=108 b=110 b=112 b=114 b=116 b=118 b=120
b=122 b=124 b=126 b=128 b=130 b=132 b=134 b=136 b=138 b=140
b=142 b=144 b=146 b=148 b=150 b=152 b=154 b=156 b=158 b=160
b=162 b=164 b=166 b=168 b=170 b=172 b=174 b=176 b=178 b=180
b=182 b=184 b=186 b=188 b=190 b=192 b=194 b=196 b=198 b=200
After permutation , E is set at: 6.756 1.736 2.846
Summarizing DEDS results for 200 permutations and 100 genes, please wait...
>
> # pairs plot
> pairs(d)
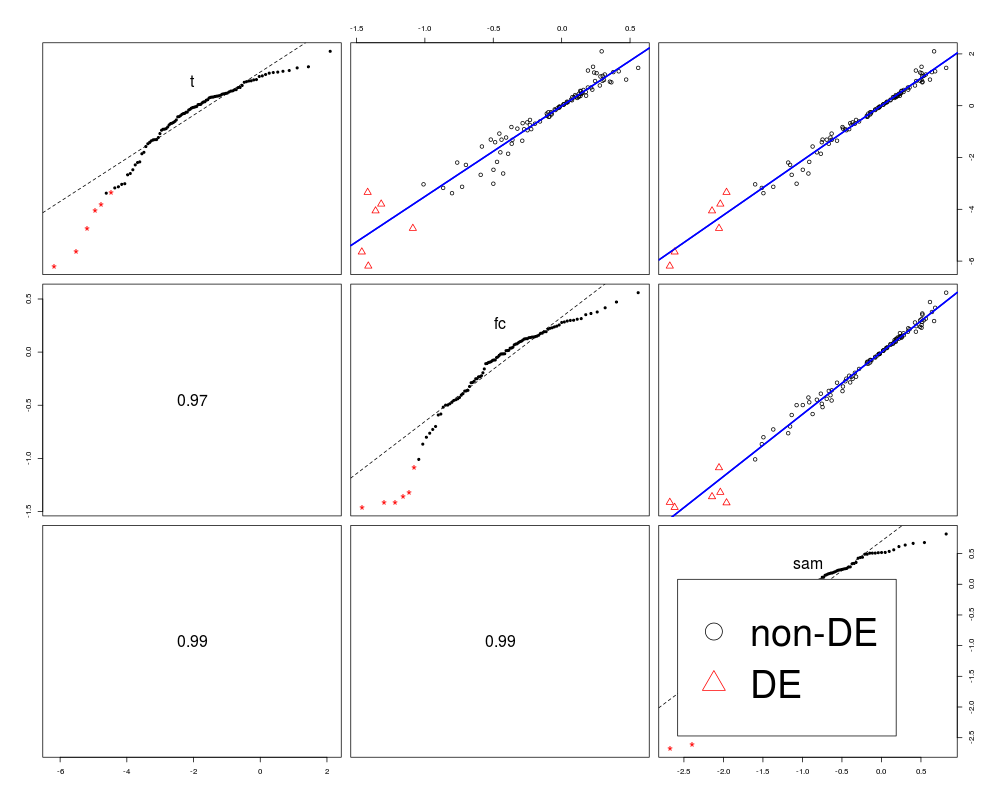
> # plot regression line
> pairs(d, reg.line=lm, lwd=2)
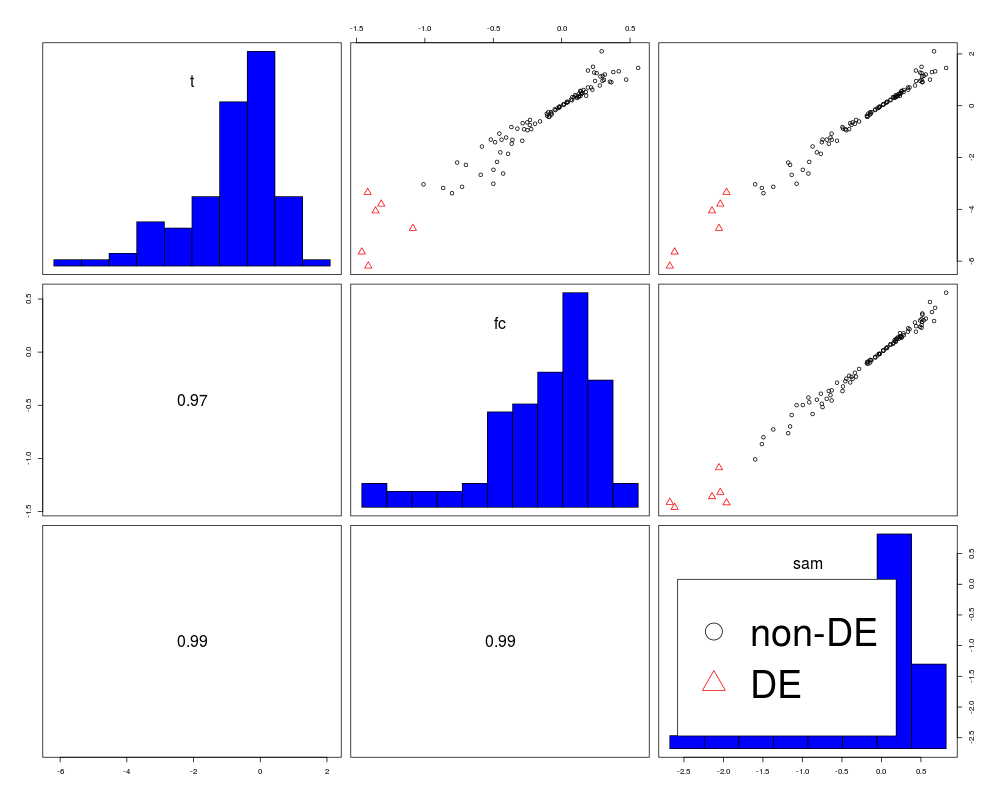
> # histogram in the diagonal panel
> pairs(d, diagonal="hist")
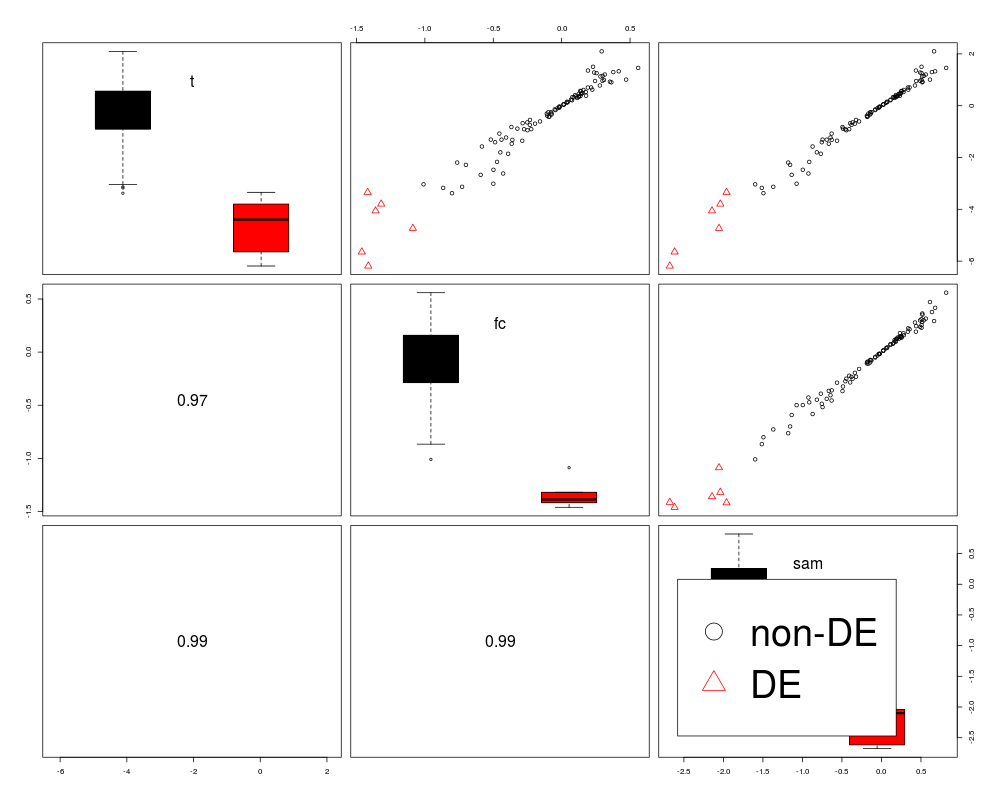
> # boxplot on the diagonal panel and stratified
> pairs(d, diagonal="boxplot", diag.by.group=TRUE)
>
>
>
>
>
> dev.off()
null device
1
>
|