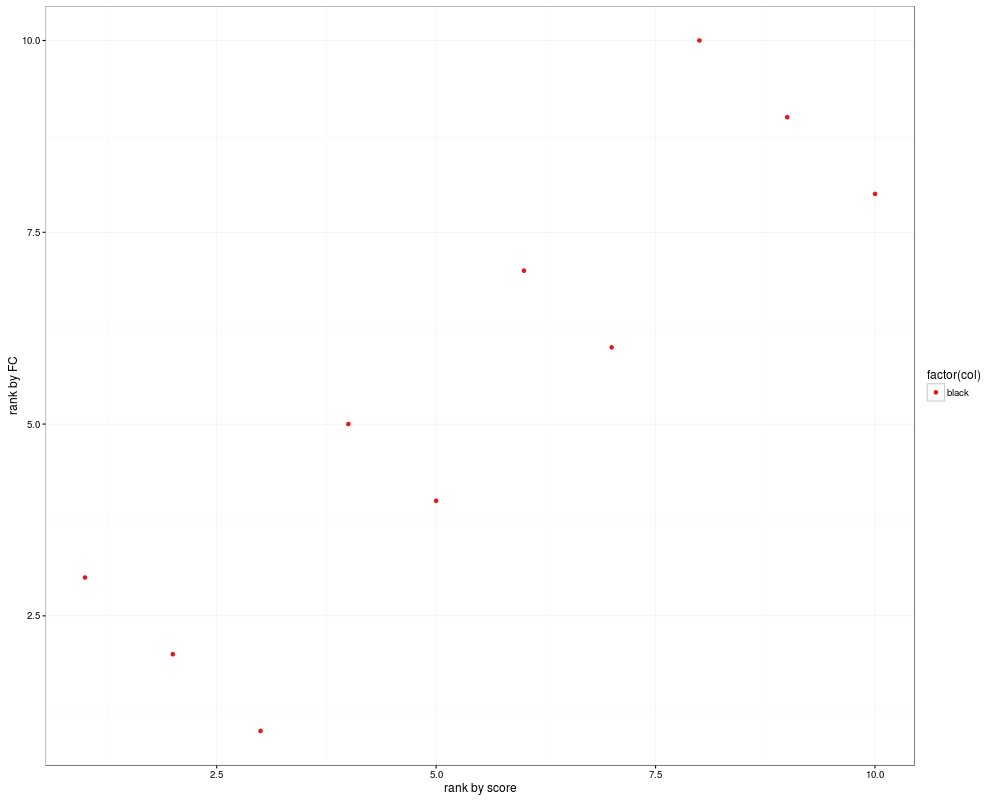
R: plot the correlation between the rank according estimator and...
degPR
R Documentation
plot the correlation between the rank according estimator and
the rank according FC
Description
plot the correlation between the rank according estimator
and the rank according FC
Usage
degPR(rank,colors)
Arguments
rank
output from degRank function
colors
colour used for each gene
Value
ggplot2 object
Examples
data(DEGreportSet)
degPR(DEGreportSet$rank)
Results
R version 3.3.1 (2016-06-21) -- "Bug in Your Hair"
Copyright (C) 2016 The R Foundation for Statistical Computing
Platform: x86_64-pc-linux-gnu (64-bit)

R is free software and comes with ABSOLUTELY NO WARRANTY.
You are welcome to redistribute it under certain conditions.
Type 'license()' or 'licence()' for distribution details.

R is a collaborative project with many contributors.
Type 'contributors()' for more information and
'citation()' on how to cite R or R packages in publications.

Type 'demo()' for some demos, 'help()' for on-line help, or
'help.start()' for an HTML browser interface to help.
Type 'q()' to quit R.

> library(DEGreport)
> png(filename="/home/ddbj/snapshot/RGM3/R_BC/result/DEGreport/degPR.Rd_%03d_medium.png", width=480, height=480)
> ### Name: degPR
> ### Title: plot the correlation between the rank according estimator and
> ###   the rank according FC
> ### Aliases: degPR
>
> ### ** Examples
>
> data(DEGreportSet)
> degPR(DEGreportSet$rank)
>
>
>
>
>
> dev.off()
null device
          1
>
 .
.