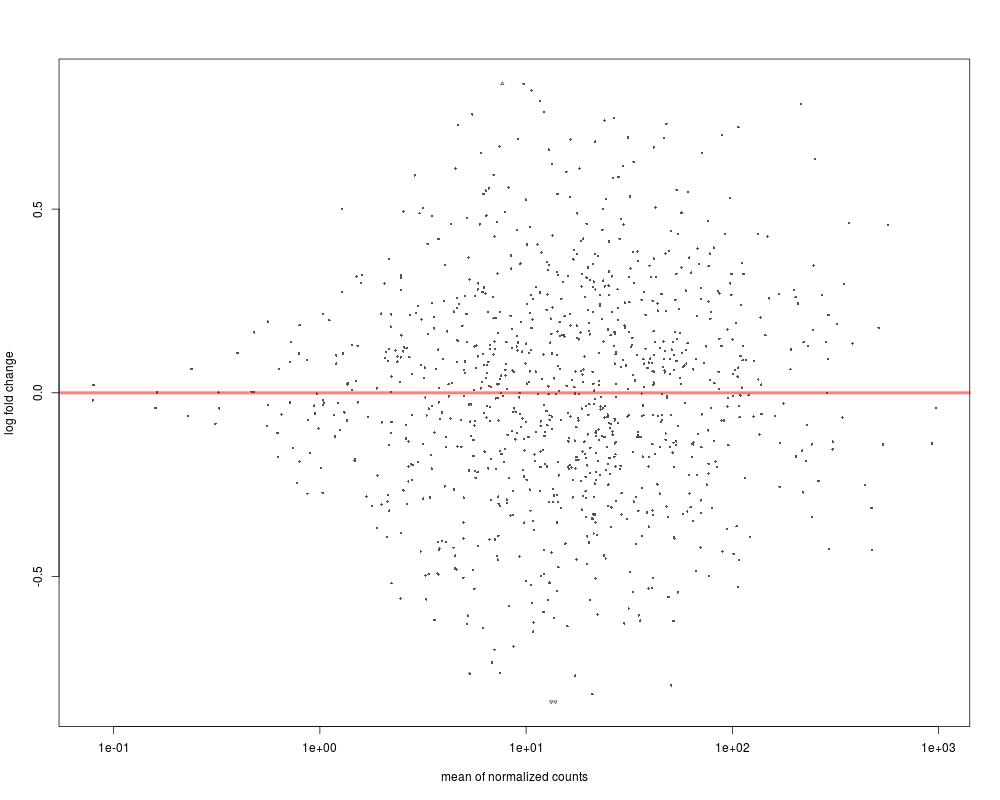
A simple helper function that makes a so-called "MA-plot", i.e. a
scatter plot of log2 fold changes (on the y-axis) versus the mean of
normalized counts (on the x-axis).
Usage
## S4 method for signature 'DESeqDataSet'
plotMA(object, alpha = 0.1, main = "",
  xlab = "mean of normalized counts", ylim, MLE = FALSE, ...)

## S4 method for signature 'DESeqResults'
plotMA(object, alpha, main = "",
  xlab = "mean of normalized counts", ylim, MLE = FALSE, ...)
Arguments
object
a DESeqResults object produced by results;
or a DESeqDataSet processed by DESeq, or the
individual functions nbinomWaldTest or nbinomLRT
alpha
the significance level for thresholding adjusted p-values
main
optional title for the plot
xlab
optional defaults to "mean of normalized counts"
ylim
optional y limits
MLE
whether to plot the MLE (unshrunken estimates), defaults to FALSE.
Requires that results was run with addMLE=TRUE.
Note that the MLE will be plotted regardless of this argument, if DESeq() was run
with betaPrior=FALSE.
...
further arguments passed to plotMA if object
is DESeqResults or to results if object is
DESeqDataSet
Details
This function is essentially two lines of code: building a
data.frame and passing this to the plotMA method
for data.frame from the geneplotter package.
The code of this function can be seen with:
getMethod("plotMA","DESeqDataSet")
If users wish to modify the graphical parameters of the plot,
it is recommended to build the data.frame in the
same manner and call plotMA.
R version 3.3.1 (2016-06-21) -- "Bug in Your Hair"
Copyright (C) 2016 The R Foundation for Statistical Computing
Platform: x86_64-pc-linux-gnu (64-bit)

R is free software and comes with ABSOLUTELY NO WARRANTY.
You are welcome to redistribute it under certain conditions.
Type 'license()' or 'licence()' for distribution details.

R is a collaborative project with many contributors.
Type 'contributors()' for more information and
'citation()' on how to cite R or R packages in publications.

Type 'demo()' for some demos, 'help()' for on-line help, or
'help.start()' for an HTML browser interface to help.
Type 'q()' to quit R.

> library(DESeq2)
Loading required package: S4Vectors
Loading required package: stats4
Loading required package: BiocGenerics
Loading required package: parallel

Attaching package: 'BiocGenerics'

The following objects are masked from 'package:parallel':

    clusterApply, clusterApplyLB, clusterCall, clusterEvalQ,
    clusterExport, clusterMap, parApply, parCapply, parLapply,
    parLapplyLB, parRapply, parSapply, parSapplyLB

The following objects are masked from 'package:stats':

    IQR, mad, xtabs

The following objects are masked from 'package:base':

    Filter, Find, Map, Position, Reduce, anyDuplicated, append,
    as.data.frame, cbind, colnames, do.call, duplicated, eval, evalq,
    get, grep, grepl, intersect, is.unsorted, lapply, lengths, mapply,
    match, mget, order, paste, pmax, pmax.int, pmin, pmin.int, rank,
    rbind, rownames, sapply, setdiff, sort, table, tapply, union,
    unique, unsplit


Attaching package: 'S4Vectors'

The following objects are masked from 'package:base':

    colMeans, colSums, expand.grid, rowMeans, rowSums

Loading required package: IRanges
Loading required package: GenomicRanges
Loading required package: GenomeInfoDb
Loading required package: SummarizedExperiment
Loading required package: Biobase
Welcome to Bioconductor

    Vignettes contain introductory material; view with
    'browseVignettes()'. To cite Bioconductor, see
    'citation("Biobase")', and for packages 'citation("pkgname")'.

> png(filename="/home/ddbj/snapshot/RGM3/R_BC/result/DESeq2/plotMA.Rd_%03d_medium.png", width=480, height=480)
> ### Name: plotMA
> ### Title: MA-plot from base means and log fold changes
> ### Aliases: plotMA plotMA,DESeqDataSet-method plotMA,DESeqResults-method
>
> ### ** Examples
>
>
> dds <- makeExampleDESeqDataSet()
> dds <- DESeq(dds)
estimating size factors
estimating dispersions
gene-wise dispersion estimates
mean-dispersion relationship
final dispersion estimates
fitting model and testing
> plotMA(dds)
> res <- results(dds)
> plotMA(res)
>
>
>
>
>
>
> dev.off()
null device
          1
>
 .
.