Supported by Dr. Osamu Ogasawara and  . . |
|
Last data update: 2014.03.03 |
Creates a Simulation objectDescriptionThis creates a simulation object which groups together all the objects needed to complete the simulation. Usagemake.simulation(reps, single.transect.set = FALSE, double.observer = FALSE, region.obj, design.obj, population.description.obj, detectability.obj, ddf.analyses.list) Arguments
Valueobject of class Simulation Author(s)Laura Marshall Examples
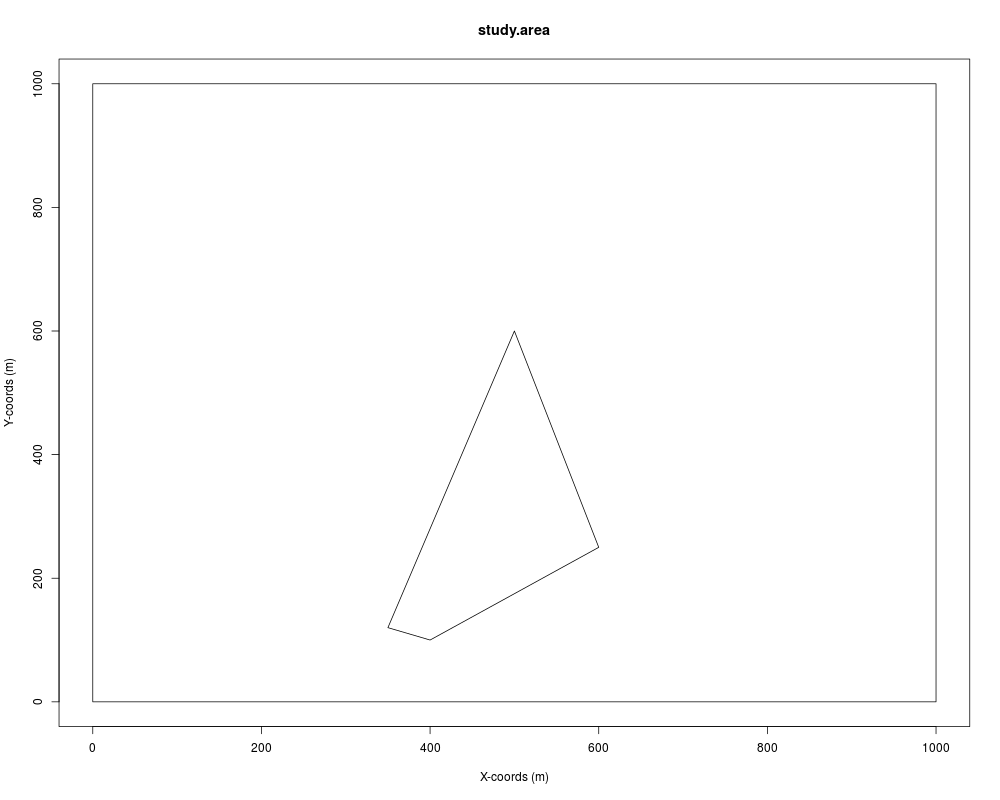
coords <- gaps <- list()
coords[[1]] <- list(data.frame(x = c(0,1000,1000,0,0), y = c(0,0,
 1000,1000,0)))
gaps[[1]] <- list(data.frame(x = c(400,600,500,350,400), y = c(100,
 250,600,120,100)))

region <- make.region(region.name = "study.area", units = "m",
 coords = coords, gaps = gaps)
plot(region)

## Not run:
data(transects.shp)
#Edit the pathway below to point to an empty folder where the
#transect shapefile will be saved
shapefile.pathway <- "C:/..."
write.shapefile(transects.shp, paste(shapefile.pathway,"/transects_1",
 sep = ""))

parallel.design <- make.design(transect.type = "Line",
 design.details = c("Parallel","Systematic"), region = region,
 design.axis = 0, spacing = 100, plus.sampling =FALSE,
 path = shapefile.pathway)

pop.density <- make.density(region.obj = region, x.space = 10,
 y.space = 10, constant = 0.5)
pop.density <- add.hotspot(pop.density, centre = c(50, 200),
 sigma = 100, amplitude = 0.1)
pop.density <- add.hotspot(pop.density, centre = c(500, 700),
 sigma = 900, amplitude = 0.05)
pop.density <- add.hotspot(pop.density, centre = c(300, 100),
 sigma = 100, amplitude = -0.15)

plot(pop.density)
plot(region, add = TRUE)

pop.description <- make.population.description(N = 1000,
 density.obj = pop.density, region = region, fixed.N = TRUE)

detect <- make.detectability(key.function = "hn", scale.param = 15,
 truncation = 30)

ddf.analyses <- make.ddf.analysis.list(dsmodel = list(~cds(key = "hn",
 formula = ~1),~cds(key = "hr", formula = ~1)), method = "ds",
 criteria = "AIC")

my.simulation <- make.simulation(reps = 10, single.transect.set = TRUE,
 region.obj = region, design.obj = parallel.design,
 population.description.obj = pop.description,
 detectability.obj = detect, ddf.analyses.list = ddf.analyses)

survey.results <- create.survey.results(my.simulation, dht.table = TRUE)

plot(survey.results)

my.simulation <- run(my.simulation)

summary(my.simulation)

## End(Not run)
Results
R version 3.3.1 (2016-06-21) -- "Bug in Your Hair"
Copyright (C) 2016 The R Foundation for Statistical Computing
Platform: x86_64-pc-linux-gnu (64-bit)

R is free software and comes with ABSOLUTELY NO WARRANTY.
You are welcome to redistribute it under certain conditions.
Type 'license()' or 'licence()' for distribution details.

R is a collaborative project with many contributors.
Type 'contributors()' for more information and
'citation()' on how to cite R or R packages in publications.

Type 'demo()' for some demos, 'help()' for on-line help, or
'help.start()' for an HTML browser interface to help.
Type 'q()' to quit R.

> library(DSsim)
Loading required package: splancs
Loading required package: sp

Spatial Point Pattern Analysis Code in S-Plus

 Version 2 - Spatial and Space-Time analysis

Loading required package: mrds
This is mrds 2.1.14
Built: R 3.3.1; ; 2016-07-02 00:29:24 UTC; unix
Loading required package: mgcv
Loading required package: nlme
This is mgcv 1.8-12. For overview type 'help("mgcv-package")'.
Loading required package: shapefiles
Loading required package: foreign

Attaching package: 'shapefiles'

The following objects are masked from 'package:foreign':

    read.dbf, write.dbf

> png(filename="/home/ddbj/snapshot/RGM3/R_CC/result/DSsim/make.simulation.Rd_%03d_medium.png", width=480, height=480)
> ### Name: make.simulation
> ### Title: Creates a Simulation object
> ### Aliases: make.simulation
>
> ### ** Examples
>
> coords <- gaps <- list()
> coords[[1]] <- list(data.frame(x = c(0,1000,1000,0,0), y = c(0,0,
+  1000,1000,0)))
> gaps[[1]] <- list(data.frame(x = c(400,600,500,350,400), y = c(100,
+  250,600,120,100)))
>
> region <- make.region(region.name = "study.area", units = "m",
+  coords = coords, gaps = gaps)
> plot(region)
>
> ## Not run:
> ##D data(transects.shp)
> ##D #Edit the pathway below to point to an empty folder where the
> ##D #transect shapefile will be saved
> ##D shapefile.pathway <- "C:/..."
> ##D write.shapefile(transects.shp, paste(shapefile.pathway,"/transects_1",
> ##D  sep = ""))
> ##D
> ##D parallel.design <- make.design(transect.type = "Line",
> ##D  design.details = c("Parallel","Systematic"), region = region,
> ##D  design.axis = 0, spacing = 100, plus.sampling =FALSE,
> ##D  path = shapefile.pathway)
> ##D
> ##D pop.density <- make.density(region.obj = region, x.space = 10,
> ##D  y.space = 10, constant = 0.5)
> ##D pop.density <- add.hotspot(pop.density, centre = c(50, 200),
> ##D  sigma = 100, amplitude = 0.1)
> ##D pop.density <- add.hotspot(pop.density, centre = c(500, 700),
> ##D  sigma = 900, amplitude = 0.05)
> ##D pop.density <- add.hotspot(pop.density, centre = c(300, 100),
> ##D  sigma = 100, amplitude = -0.15)
> ##D
> ##D plot(pop.density)
> ##D plot(region, add = TRUE)
> ##D
> ##D pop.description <- make.population.description(N = 1000,
> ##D  density.obj = pop.density, region = region, fixed.N = TRUE)
> ##D
> ##D detect <- make.detectability(key.function = "hn", scale.param = 15,
> ##D  truncation = 30)
> ##D
> ##D ddf.analyses <- make.ddf.analysis.list(dsmodel = list(~cds(key = "hn",
> ##D  formula = ~1),~cds(key = "hr", formula = ~1)), method = "ds",
> ##D  criteria = "AIC")
> ##D
> ##D my.simulation <- make.simulation(reps = 10, single.transect.set = TRUE,
> ##D  region.obj = region, design.obj = parallel.design,
> ##D  population.description.obj = pop.description,
> ##D  detectability.obj = detect, ddf.analyses.list = ddf.analyses)
> ##D
> ##D survey.results <- create.survey.results(my.simulation, dht.table = TRUE)
> ##D
> ##D plot(survey.results)
> ##D
> ##D my.simulation <- run(my.simulation)
> ##D
> ##D summary(my.simulation)
> ## End(Not run)
>
>
>
>
>
>
> dev.off()
null device
          1
>
|
Created & Maintained by Osamu Ogasawara (osamu.ogasawara@gmail.com) and 