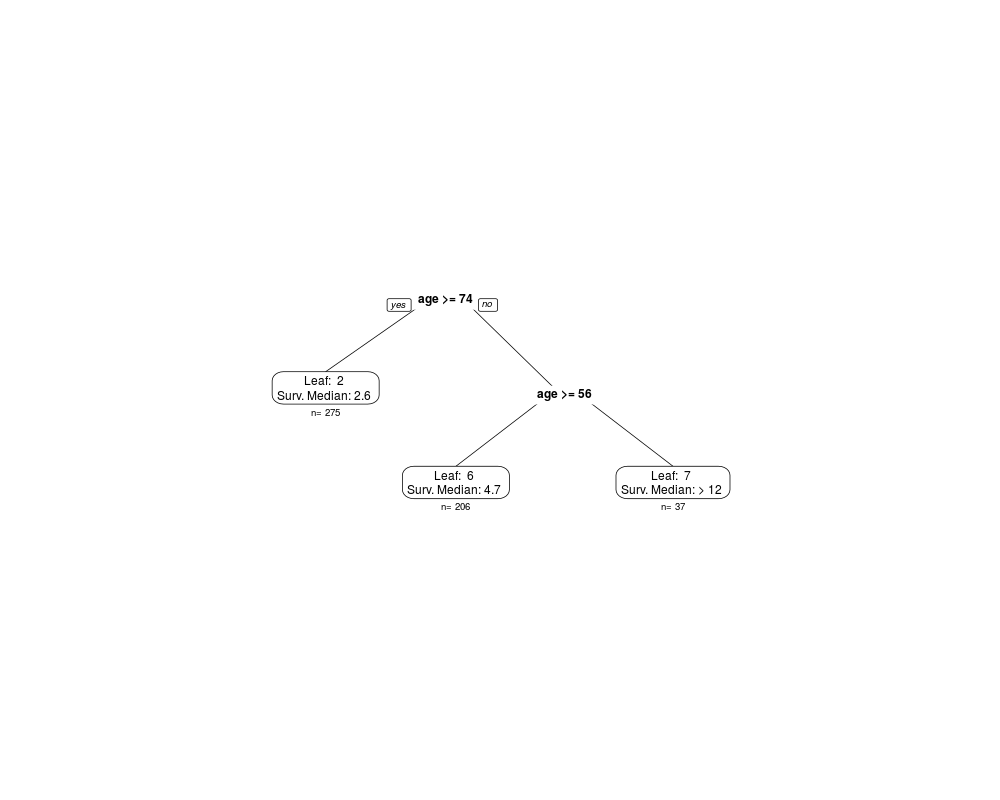
This function plots a DStree object on the current graphic
device. It visualizes the fitted tree as well as the
estimated survival/hazard probabilites for every terminal
node.
Usage
## S3 method for class 'DStree'
plot(x, prob = "surv", select = NULL, ...)
Arguments
x
a fitted object of class "DStree"
prob
a string that indicates which probability should be
plotted. "surv" draws survival probabilities,
"haz" draws hazard probabilities.
select
a vector of strings that indicate terminal leaves
for which the survival/hazard probabilities should be
drawn. If not specified probabilities for every terminal leaf
are drawn.
...
extra prp arguments to modify the
appearance of the tree (from R package
rpart.plot)
Examples
data(cost)
# Discretize observed days to years
d.cost<-dis.cost(cost)
# Grow tree
fit <- DStree(time~prevStroke+age+sex+alcohol+smoke,status="status",data=d.cost)
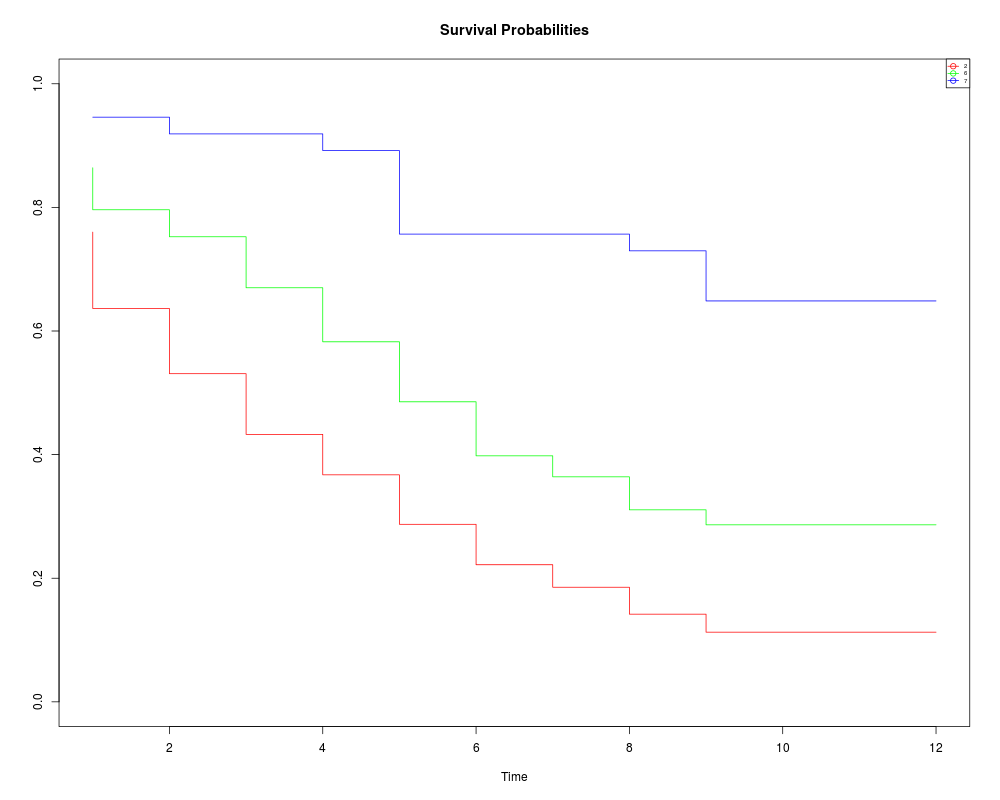
#Plot tree and survival probabilities
plot(fit)
#survival probabilities are in the first plot
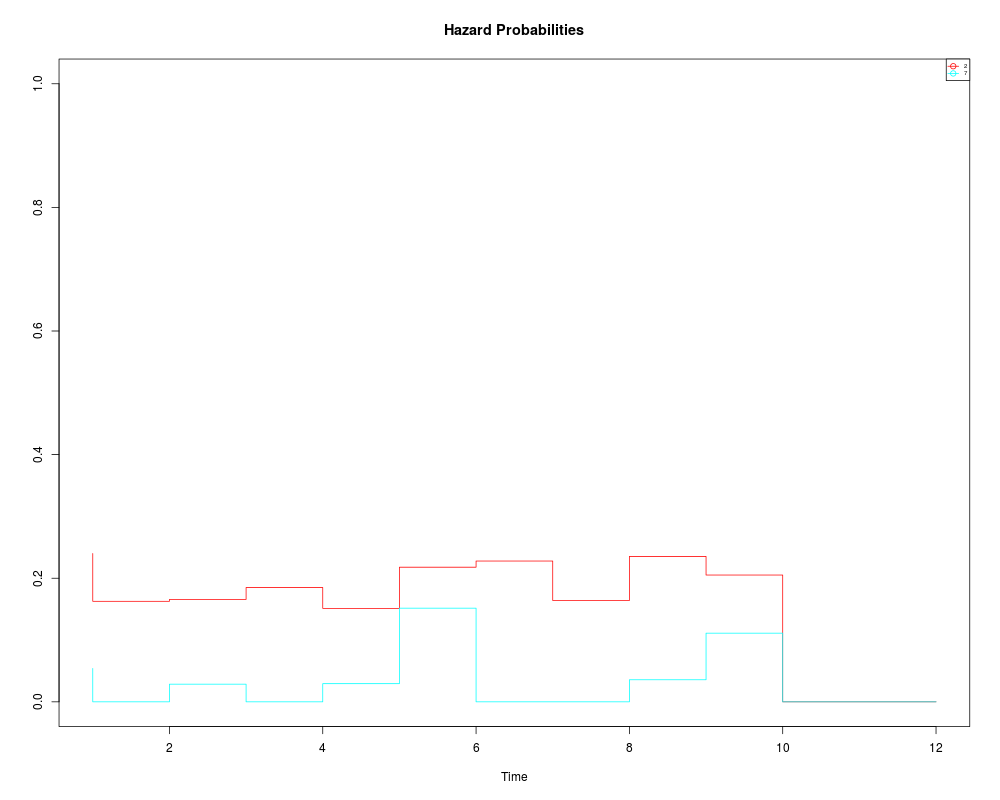
#Plot tree and hazard probabilities for terminal leaves 4 and 15
plot(fit,prob="haz",select=c("2","7"))
Results
R version 3.3.1 (2016-06-21) -- "Bug in Your Hair"
Copyright (C) 2016 The R Foundation for Statistical Computing
Platform: x86_64-pc-linux-gnu (64-bit)

R is free software and comes with ABSOLUTELY NO WARRANTY.
You are welcome to redistribute it under certain conditions.
Type 'license()' or 'licence()' for distribution details.

R is a collaborative project with many contributors.
Type 'contributors()' for more information and
'citation()' on how to cite R or R packages in publications.

Type 'demo()' for some demos, 'help()' for on-line help, or
'help.start()' for an HTML browser interface to help.
Type 'q()' to quit R.

> library(DStree)
Loading required package: rpart
Loading required package: pec
Loading required package: prodlim
Loading required package: Ecdat
Loading required package: Ecfun

Attaching package: 'Ecfun'

The following object is masked from 'package:base':

    sign


Attaching package: 'Ecdat'

The following object is masked from 'package:datasets':

    Orange

> png(filename="/home/ddbj/snapshot/RGM3/R_CC/result/DStree/plot.DStree.Rd_%03d_medium.png", width=480, height=480)
> ### Name: plot.DStree
> ### Title: Plot a DStree Object
> ### Aliases: plot.DStree
>
> ### ** Examples
>
> data(cost)
> # Discretize observed days to years
> d.cost<-dis.cost(cost)
>
> # Grow tree
> fit <- DStree(time~prevStroke+age+sex+alcohol+smoke,status="status",data=d.cost)
>
> #Plot tree and survival probabilities
> plot(fit)
> #survival probabilities are in the first plot
>
> #Plot tree and hazard probabilities for terminal leaves 4 and 15
> plot(fit,prob="haz",select=c("2","7"))
>
>
>
>
>
> dev.off()
null device
          1
>
 .
.