Supported by Dr. Osamu Ogasawara and  . . |
|
Last data update: 2014.03.03 |
Prune a fitted survival treeDescriptionThe Usage## S3 method for class 'DStree' prune(tree, data, gamma = 2, which, ...) Arguments
DetailsThe subtrees are the cost-minimzing subtrees in terms of deviance for given complexity parameters of the fitted tree. See Therneau et al (2013) p.12-13. Value
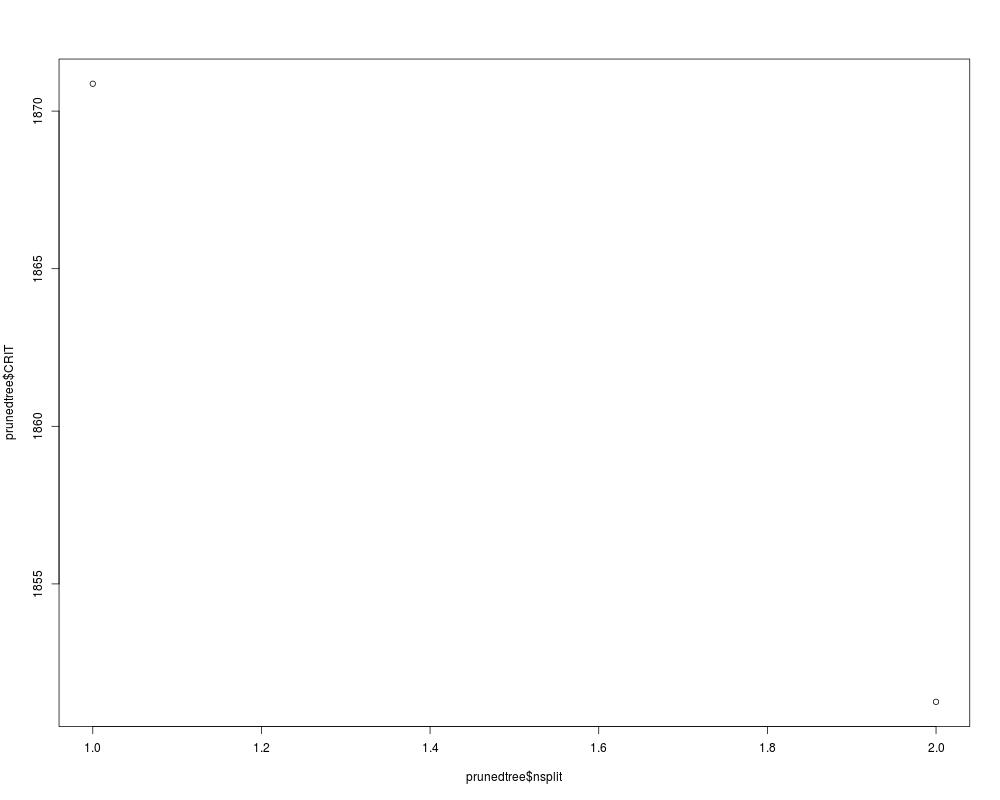
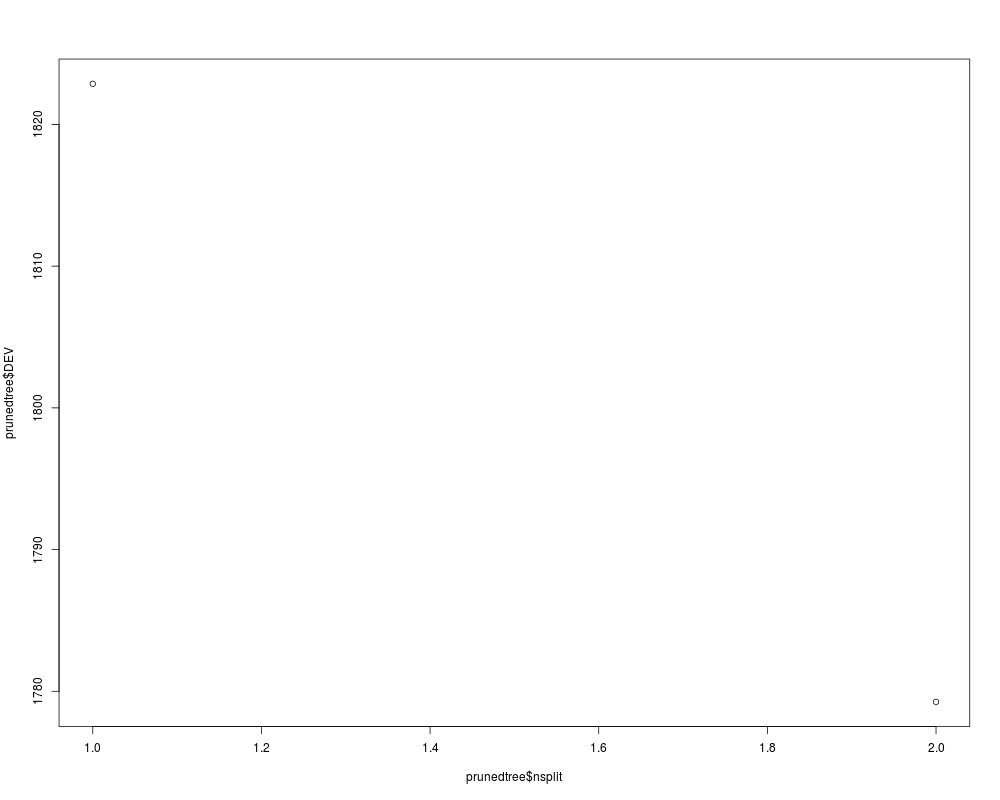
ReferencesHothorn T., Lausen B., Benner A. and Radespiel-Troeger M. (2004), Bagging Survival Trees. Statistics in medicine 23 (1), 77-91. Therneau T. and Atkinson E., An introduction to recursive partitioning using the RPART routines, Technical Report 61, Section of Biostatistics, Mayo Clinic, Rochester. Examplesdata(cost) ## Discretize observed days to years d.cost <- dis.cost(cost) ##Build tree tree <- DStree(time~prevStroke+age+sex+alcohol+smoke,status="status",data=d.cost) # Determine subtree with minimum AIC prunedtree <- prune(tree,d.cost,which="CRIT") prunedtree$prunedfit # Visualize AIC/Deviance of subtrees plot(prunedtree$nsplit,prunedtree$CRIT) plot(prunedtree$nsplit,prunedtree$DEV) Results
R version 3.3.1 (2016-06-21) -- "Bug in Your Hair"
Copyright (C) 2016 The R Foundation for Statistical Computing
Platform: x86_64-pc-linux-gnu (64-bit)

R is free software and comes with ABSOLUTELY NO WARRANTY.
You are welcome to redistribute it under certain conditions.
Type 'license()' or 'licence()' for distribution details.

R is a collaborative project with many contributors.
Type 'contributors()' for more information and
'citation()' on how to cite R or R packages in publications.

Type 'demo()' for some demos, 'help()' for on-line help, or
'help.start()' for an HTML browser interface to help.
Type 'q()' to quit R.

> library(DStree)
Loading required package: rpart
Loading required package: pec
Loading required package: prodlim
Loading required package: Ecdat
Loading required package: Ecfun

Attaching package: 'Ecfun'

The following object is masked from 'package:base':

    sign


Attaching package: 'Ecdat'

The following object is masked from 'package:datasets':

    Orange

> png(filename="/home/ddbj/snapshot/RGM3/R_CC/result/DStree/prune.DStree.Rd_%03d_medium.png", width=480, height=480)
> ### Name: prune.DStree
> ### Title: Prune a fitted survival tree
> ### Aliases: prune.DStree
>
> ### ** Examples
>
> data(cost)
> ## Discretize observed days to years
> d.cost <- dis.cost(cost)
>
> ##Build tree
> tree <- DStree(time~prevStroke+age+sex+alcohol+smoke,status="status",data=d.cost)
>
> # Determine subtree with minimum AIC
> prunedtree <- prune(tree,d.cost,which="CRIT")
> prunedtree$prunedfit
n= 518

node), split, n, deviance, Med Surv
      * denotes terminal node

1) root 518 2303.6310 3.6
  2) age>=74.5 275 1227.1380 2.6 *
  3) age< 74.5 243 1018.7160 5.6
    6) age>=55.5 206  893.5323 4.7 *
    7) age< 55.5 37   89.2027  NA *
>
> # Visualize AIC/Deviance of subtrees
> plot(prunedtree$nsplit,prunedtree$CRIT)
> plot(prunedtree$nsplit,prunedtree$DEV)
>
>
>
>
>
> dev.off()
null device
          1
>
|