Supported by Dr. Osamu Ogasawara and  . . |
|
Last data update: 2014.03.03 |
Deriving the MST criteriaDescriptionCompute both the mean and the standard deviation of the Minimal Spanning Tree (MST) UsagemstCriteria(design,plot2d="FALSE") Arguments
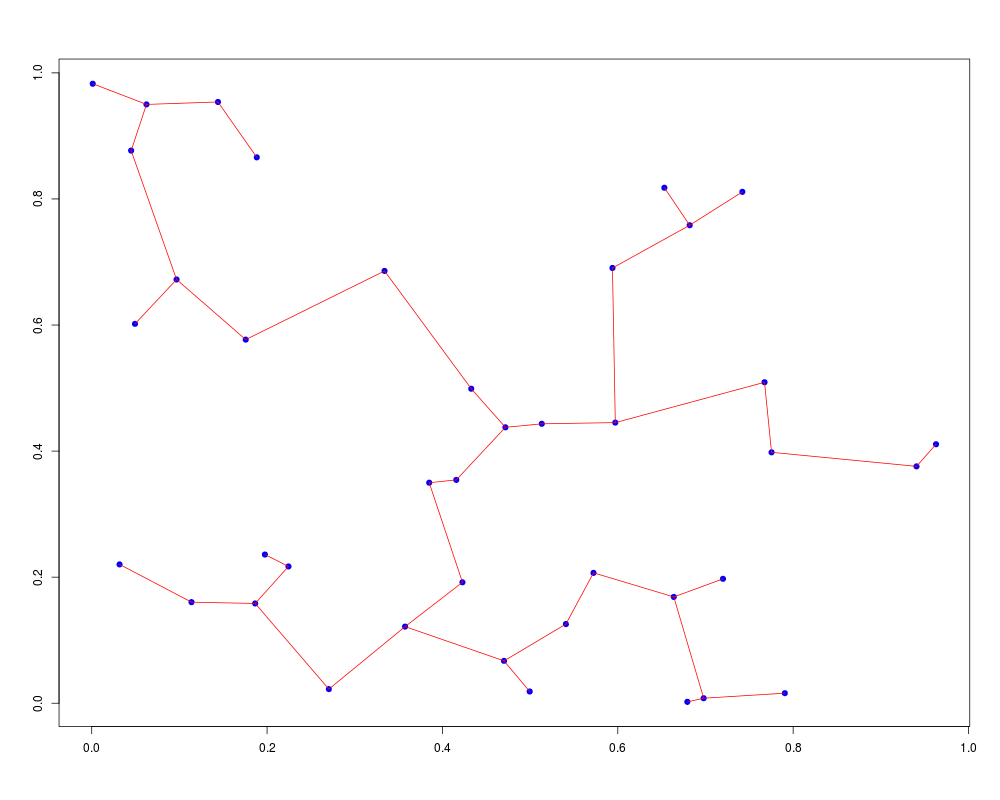
DetailsIn our context, a MST is a tree whose the sum of the lengthes of the edges is minimal. Even if unicity does not hold, the overall length is stable. The mean and the standard deviation of the lengthes of the edges are usually derived to analyze the geometric profile of the design. A large mean and a small standard deviation characterize a so-called quasi-periodic design. ValueA list containing two components:
Author(s)G.Damblin & B.Iooss ReferencesDamblin G., Couplet M., and Iooss B. (2013). Numerical studies of space filling designs: optimization of Latin hypercube samples and subprojection properties, Journal of Simulation, 7:276-289, 2013. http://www.gdr-mascotnum.fr/doku.php?id=iooss1 Dussert, C., Rasigni, G., Rasigni, M., and Palmari, J. (1986). Minimal spanning tree: A new approach for studying order and disorder. Physical Review B, 34(5):3528-3531. Franco J. (2008). Planification d'experiences numerique en phase exploratoire pour la simulation des phenomenes complexes, PhD thesis, Ecole Nationale Superieure des Mines de Saint Etienne. Franco, J., Vasseur, O., Corre, B., and Sergent, M. (2009). Minimum spanning tree: A new approach to assess the quality of the design of computer experiments. Chemometrics and Intelligent Laboratory Systems, 97:164-169. Prim, R.C. (1957). Shortest connection networks and some generalizations, in Bell System Technical Journal 36:1389-1401. Examplesdimension <- 2 n <- 40 X <- matrix(runif(n*dimension),n,dimension) mstCriteria(X,plot2d=TRUE) Results
R version 3.3.1 (2016-06-21) -- "Bug in Your Hair"
Copyright (C) 2016 The R Foundation for Statistical Computing
Platform: x86_64-pc-linux-gnu (64-bit)

R is free software and comes with ABSOLUTELY NO WARRANTY.
You are welcome to redistribute it under certain conditions.
Type 'license()' or 'licence()' for distribution details.

R is a collaborative project with many contributors.
Type 'contributors()' for more information and
'citation()' on how to cite R or R packages in publications.

Type 'demo()' for some demos, 'help()' for on-line help, or
'help.start()' for an HTML browser interface to help.
Type 'q()' to quit R.

> library(DiceDesign)
> png(filename="/home/ddbj/snapshot/RGM3/R_CC/result/DiceDesign/mstCriteria.Rd_%03d_medium.png", width=480, height=480)
> ### Name: mstCriteria
> ### Title: Deriving the MST criteria
> ### Aliases: mstCriteria
> ### Keywords: design
>
> ### ** Examples
>
> dimension <- 2
> n <- 40
> X <- matrix(runif(n*dimension),n,dimension)
> mstCriteria(X,plot2d=TRUE)
$tree
$tree[[1]]
[1] 25  3

$tree[[2]]
[1] 31

$tree[[3]]
[1]  1 24

$tree[[4]]
[1] 36

$tree[[5]]
[1] 13 37

$tree[[6]]
[1] 40

$tree[[7]]
[1] 33 11

$tree[[8]]
[1] 14

$tree[[9]]
[1] 29 34

$tree[[10]]
[1] 35 13

$tree[[11]]
[1]  7 19

$tree[[12]]
[1] 39 23

$tree[[13]]
[1] 10 26  5

$tree[[14]]
[1] 30  8

$tree[[15]]
[1] 34 38 40

$tree[[16]]
[1] 27

$tree[[17]]
[1] 25 32

$tree[[18]]
[1] 30

$tree[[19]]
[1] 11

$tree[[20]]
[1] 28

$tree[[21]]
[1] 37

$tree[[22]]
[1] 23

$tree[[23]]
[1] 12 22 28

$tree[[24]]
[1] 3

$tree[[25]]
[1]  1 17 39

$tree[[26]]
[1] 13 30

$tree[[27]]
[1] 34 16 31

$tree[[28]]
[1] 23 35 20

$tree[[29]]
[1] 37  9 36

$tree[[30]]
[1] 26 14 18

$tree[[31]]
[1] 27  2

$tree[[32]]
[1] 17 33

$tree[[33]]
[1] 32  7

$tree[[34]]
[1]  9 15 27

$tree[[35]]
[1] 28 10

$tree[[36]]
[1] 29  4

$tree[[37]]
[1]  5 29 21

$tree[[38]]
[1] 15

$tree[[39]]
[1] 25 12

$tree[[40]]
[1] 15  6


$stats
[1] 0.10776380 0.05868935

>
>
>
>
>
> dev.off()
null device
          1
>
|