Supported by Dr. Osamu Ogasawara and  . . |
|
Last data update: 2014.03.03 |
3D graphical tool for defect detection of Space-Filling Designs.DescriptionFor a 3-dimensional design, the 3D radial scanning statistic (RSS) scans angularly the domain. In each direction, it compares the distribution of projected points to their theoretical distribution under the assumption that all design points are drawn from uniform distribution. For a d-dimensional design, all triplets of dimensions are scanned. The RSS detects the defects of low discrepancy sequences or orthogonal arrays, and can be used for selecting space-filling designs. Usagerss3d(design, lower, upper, gof.test.type = "greenwood", gof.test.stat = NULL, transform = NULL, n.angle = 60, graphics = 1, trace = TRUE) Arguments
DetailsThe RSS surface is continuous. However for computational purposes, a discretization is used. The default discretization step is tunable with Valuea list with components:
Author(s)O. Roustant ReferencesRoustant O., Franco J., Carraro L., Jourdan A. (2010), A radial scanning statistic for selecting space-filling designs in computer experiments, MODA-9 proceedings, www.emse.fr/~roustant D Agostino R.B., Stephens M.A. (1986), Goodness-of-fit techniques, CRC Press, New York. See Also
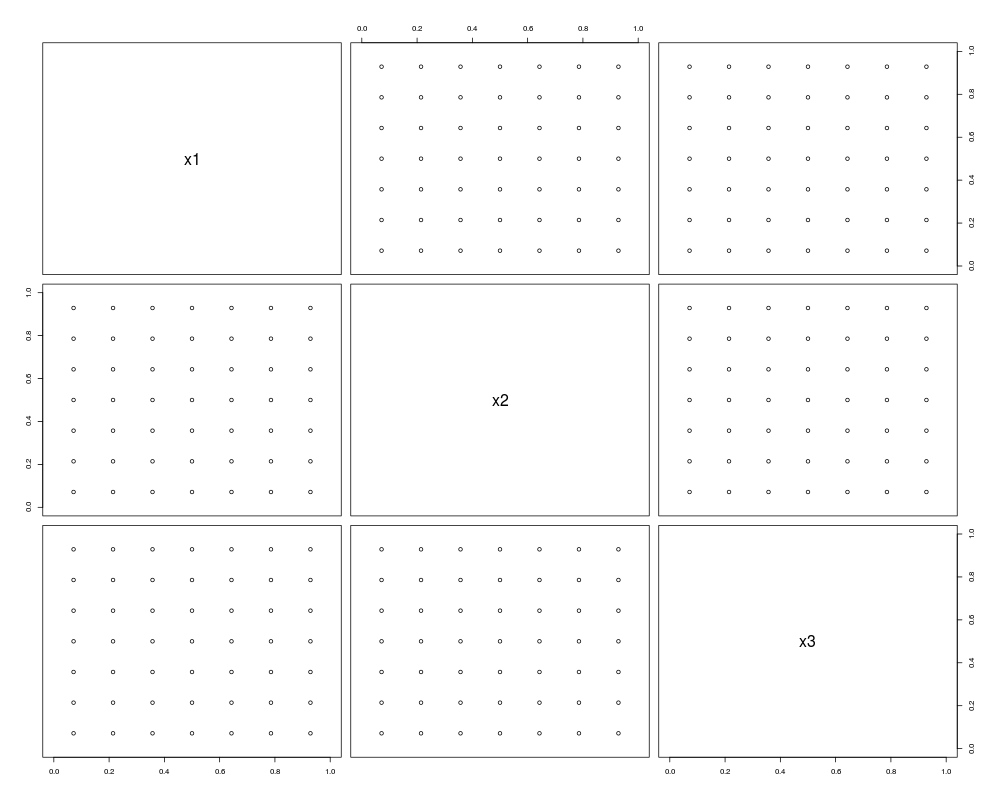
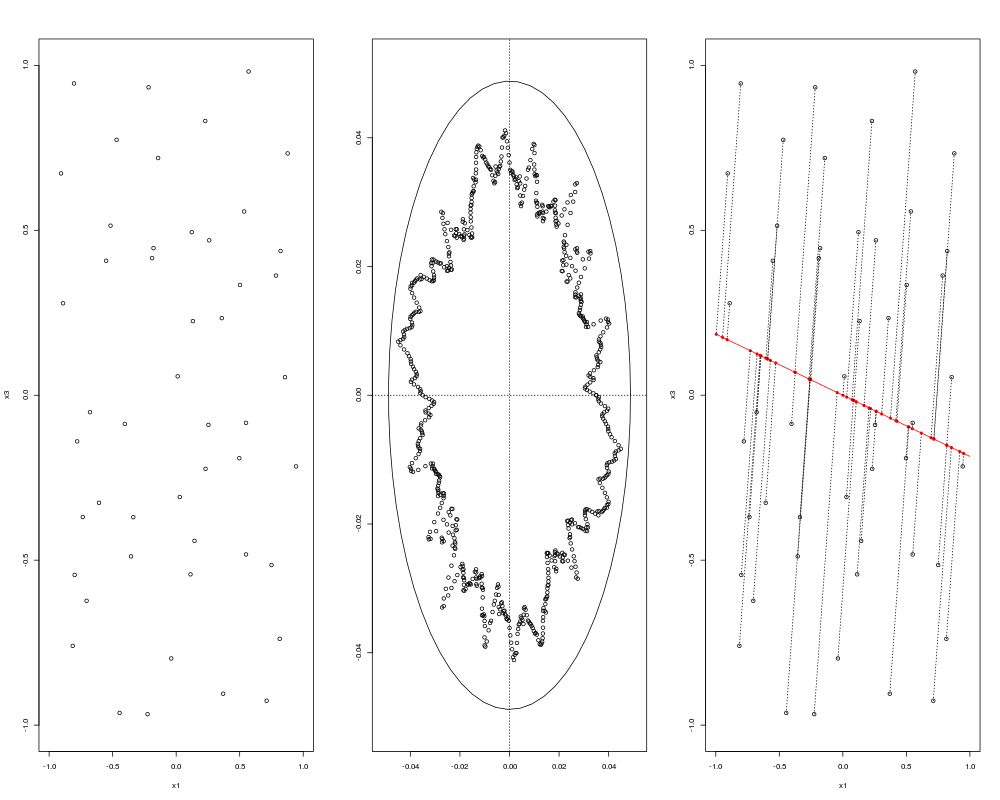
Examples# An orthogonal array in 3D data(OA131) # centering the design points of this 7-levels design OA <- (OA131 + 0.5)/7 # 2D projections onto coordinate axis pairs(OA, xlim=c(0,1), ylim=c(0,1)) # Now let us look at the 3D properties with the 3D RSS (requires the rgl package) rss <- rss3d(OA, lower=c(0,0,0), upper=c(1,1,1)) # The worst direction detected is nearly proportional to (2,-1,2) # (type "?OA131" for explanations about this linear orthogonal array) print(rss$worst.dir) # Now, scramble this design # X <- (OA131 + matrix(runif(49*3, 49, 3)))/7 # or load the design obtained this way data(OA131_scrambled) OA2 <- OA131_scrambled # no feature is detected by the 2D RSS: rss <- rss2d(OA2, lower=c(0,0,0), upper=c(1,1,1)) # 4 clusters are detected by the 3D RSS: rss <- rss3d(OA2, lower=c(0,0,0), upper=c(1,1,1)) # Defect detection of 8D Sobol sequences # All triplets of dimensions are tried to detect the worst defect # (according to the specified goodness-of-fit statistic). # requires randtoolbox library to generate the Sobol sequence ## Not run: library(randtoolbox) d <- 8 n <- 10*d rss <- rss3d(design=sobol(n=n, dim=d), lower=rep(0,d), upper=rep(1,d)) ## End(Not run) Results
R version 3.3.1 (2016-06-21) -- "Bug in Your Hair"
Copyright (C) 2016 The R Foundation for Statistical Computing
Platform: x86_64-pc-linux-gnu (64-bit)

R is free software and comes with ABSOLUTELY NO WARRANTY.
You are welcome to redistribute it under certain conditions.
Type 'license()' or 'licence()' for distribution details.

R is a collaborative project with many contributors.
Type 'contributors()' for more information and
'citation()' on how to cite R or R packages in publications.

Type 'demo()' for some demos, 'help()' for on-line help, or
'help.start()' for an HTML browser interface to help.
Type 'q()' to quit R.

> library(DiceDesign)
> png(filename="/home/ddbj/snapshot/RGM3/R_CC/result/DiceDesign/rss3d.Rd_%03d_medium.png", width=480, height=480)
> ### Name: rss3d
> ### Title: 3D graphical tool for defect detection of Space-Filling Designs.
> ### Aliases: rss3d
> ### Keywords: design
>
> ### ** Examples
>
> 	# An orthogonal array in 3D
> data(OA131)
>
> 	# centering the design points of this 7-levels design
> OA <- (OA131 + 0.5)/7
>
> 	# 2D projections onto coordinate axis
> pairs(OA, xlim=c(0,1), ylim=c(0,1))
> 	# Now let us look at the 3D properties with the 3D RSS (requires the rgl package)
> rss <- rss3d(OA, lower=c(0,0,0), upper=c(1,1,1))

3D Radial Scanning Statistic (RSS) with GREENWOOD statistic
Discretization step (in degree) : 3

Maximum of RS statistic values (global statistic) per triplet of dimensions
(1,2,3) 0.2621302

> 	# The worst direction detected is nearly proportional to (2,-1,2)
> 	# (type "?OA131" for explanations about this linear orthogonal array)
> print(rss$worst.dir)
[1] -0.6511796  0.3317926 -0.6825531
>
> # Now, scramble this design
> # X <- (OA131 + matrix(runif(49*3, 49, 3)))/7
> # or load the design obtained this way
> data(OA131_scrambled)
> OA2 <- OA131_scrambled
>
> # no feature is detected by the 2D RSS:
> rss <- rss2d(OA2, lower=c(0,0,0), upper=c(1,1,1))

2D Radial Scanning Statistic (RSS) with GREENWOOD statistic
Discretization step (in degree) : 0.5

Maximum of RS statistic values (global statistic) per pair of dimensions
(1,2) 0.04302473
(1,3) 0.04567204
(2,3) 0.04517228

> # 4 clusters are detected by the 3D RSS:
> rss <- rss3d(OA2, lower=c(0,0,0), upper=c(1,1,1))

3D Radial Scanning Statistic (RSS) with GREENWOOD statistic
Discretization step (in degree) : 3

Maximum of RS statistic values (global statistic) per triplet of dimensions
(1,2,3) 0.1068178

>
>
> 	# Defect detection of 8D Sobol sequences
> 	# All triplets of dimensions are tried to detect the worst defect
> 	# (according to the specified goodness-of-fit statistic).
> 	# requires randtoolbox library to generate the Sobol sequence
> ## Not run:
> ##D library(randtoolbox)
> ##D d <- 8
> ##D n <- 10*d
> ##D rss <- rss3d(design=sobol(n=n, dim=d), lower=rep(0,d), upper=rep(1,d))
> ## End(Not run)
>
>
>
>
>
> dev.off()
null device
          1
>
|