Supported by Dr. Osamu Ogasawara and  . . |
|
Last data update: 2014.03.03 |
Low discrepancy sequence : FaureDescriptionGenerate a Faure sequence with n experiments in [0,1]^d. Usagerunif.faure(n, dimension) Arguments
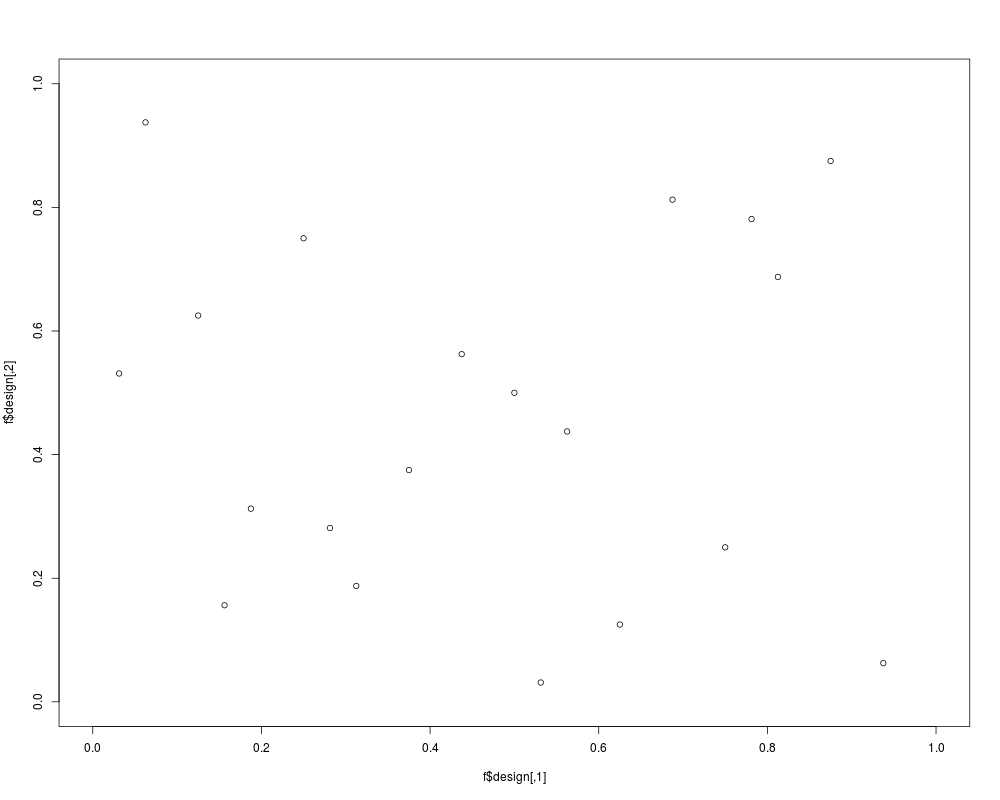
DetailsA quasirandom or low discrepancy sequence, such as the Faure, Halton, Hammersley, Niederreiter or Sobol sequences, is "less random" than a pseudorandom number sequence, but more useful for such tasks as approximation of integrals in higher dimensions, and in global optimization. This is because low discrepancy sequences tend to sample space "more uniformly" than random numbers. see randtoolbox or fOptions packages for other low discrepancy sequences. Value
Author(s)J. Franco ReferencesFaure H. (1982) Discrepance de suites associees a un systeme de numeration (en dimension s), Acta Arith. 41, 337-351 Examplesf <- runif.faure(20,2) plot(f$design,xlim=c(0,1),ylim=c(0,1)) Results
R version 3.3.1 (2016-06-21) -- "Bug in Your Hair"
Copyright (C) 2016 The R Foundation for Statistical Computing
Platform: x86_64-pc-linux-gnu (64-bit)

R is free software and comes with ABSOLUTELY NO WARRANTY.
You are welcome to redistribute it under certain conditions.
Type 'license()' or 'licence()' for distribution details.

R is a collaborative project with many contributors.
Type 'contributors()' for more information and
'citation()' on how to cite R or R packages in publications.

Type 'demo()' for some demos, 'help()' for on-line help, or
'help.start()' for an HTML browser interface to help.
Type 'q()' to quit R.

> library(DiceDesign)
> png(filename="/home/ddbj/snapshot/RGM3/R_CC/result/DiceDesign/runif.faure.Rd_%03d_medium.png", width=480, height=480)
> ### Name: runif.faure
> ### Title: Low discrepancy sequence : Faure
> ### Aliases: runif.faure
> ### Keywords: design
>
> ### ** Examples
>
> f <- runif.faure(20,2)
> plot(f$design,xlim=c(0,1),ylim=c(0,1))
>
>
>
>
>
> dev.off()
null device
          1
>
|