Supported by Dr. Osamu Ogasawara and  . . |
|
Last data update: 2014.03.03 |
2D test functionDescriptionBranin-Hoo 2-dimensional test function. Usagebranin(x) Arguments
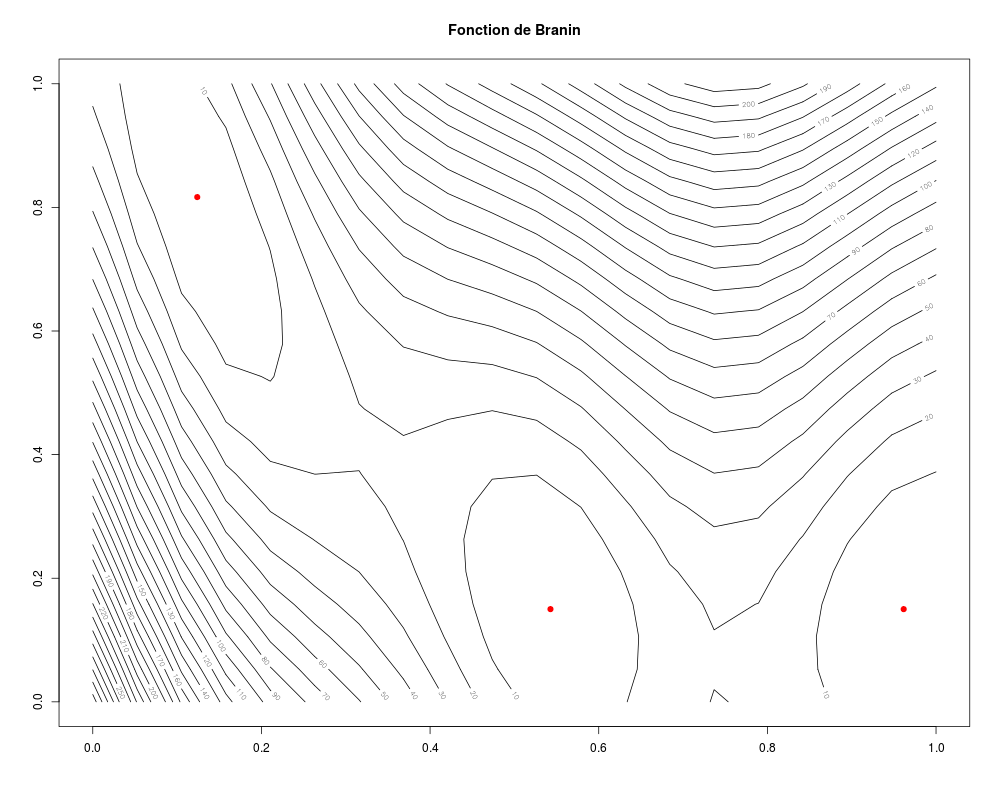
DetailsThe Branin-Hoo function is defined here over [0,1] x [0,1], instead of [-5,0] x [10,15] as usual. It has 3 global minima : x1 = c(0.9616520, 0.15); x2 = c(0.1238946, 0.8166644); x3 = c(0.5427730, 0.15) ValueA real number equal to the Branin-Hoo function values at Author(s)D. Ginsbourger, Ecole des Mines de St-Etienne. Examples
n.grid <- 20
x.grid <- y.grid <- seq(0,1,length=n.grid)
design.grid <- expand.grid(x.grid, y.grid)
response.grid <- apply(design.grid, 1, branin)
z.grid <- matrix(response.grid, n.grid, n.grid)
contour(x.grid,y.grid,z.grid,40)
x1 = c(0.9616520, 0.15); x2 = c(0.1238946, 0.8166644); x3 = c(0.5427730, 0.15)
points(rbind(t(x1), t(x2), t(x3)), pch=19, col="red")
title("Fonction de Branin")
Results
R version 3.3.1 (2016-06-21) -- "Bug in Your Hair"
Copyright (C) 2016 The R Foundation for Statistical Computing
Platform: x86_64-pc-linux-gnu (64-bit)

R is free software and comes with ABSOLUTELY NO WARRANTY.
You are welcome to redistribute it under certain conditions.
Type 'license()' or 'licence()' for distribution details.

R is a collaborative project with many contributors.
Type 'contributors()' for more information and
'citation()' on how to cite R or R packages in publications.

Type 'demo()' for some demos, 'help()' for on-line help, or
'help.start()' for an HTML browser interface to help.
Type 'q()' to quit R.

> library(DiceKriging)
> png(filename="/home/ddbj/snapshot/RGM3/R_CC/result/DiceKriging/branin.Rd_%03d_medium.png", width=480, height=480)
> ### Name: branin
> ### Title: 2D test function
> ### Aliases: branin
> ### Keywords: optimize internal
>
> ### ** Examples
>
> n.grid <- 20
> x.grid <- y.grid <- seq(0,1,length=n.grid)
> design.grid <- expand.grid(x.grid, y.grid)
> response.grid <- apply(design.grid, 1, branin)
> z.grid <- matrix(response.grid, n.grid, n.grid)
> contour(x.grid,y.grid,z.grid,40)
> x1 = c(0.9616520, 0.15); x2 = c(0.1238946, 0.8166644); x3 = c(0.5427730, 0.15)
> points(rbind(t(x1), t(x2), t(x3)), pch=19, col="red")
> title("Fonction de Branin")
>
>
>
>
>
> dev.off()
null device
          1
>
|
Created & Maintained by Osamu Ogasawara (osamu.ogasawara@gmail.com) and 