Supported by Dr. Osamu Ogasawara and  . . |
|
Last data update: 2014.03.03 |
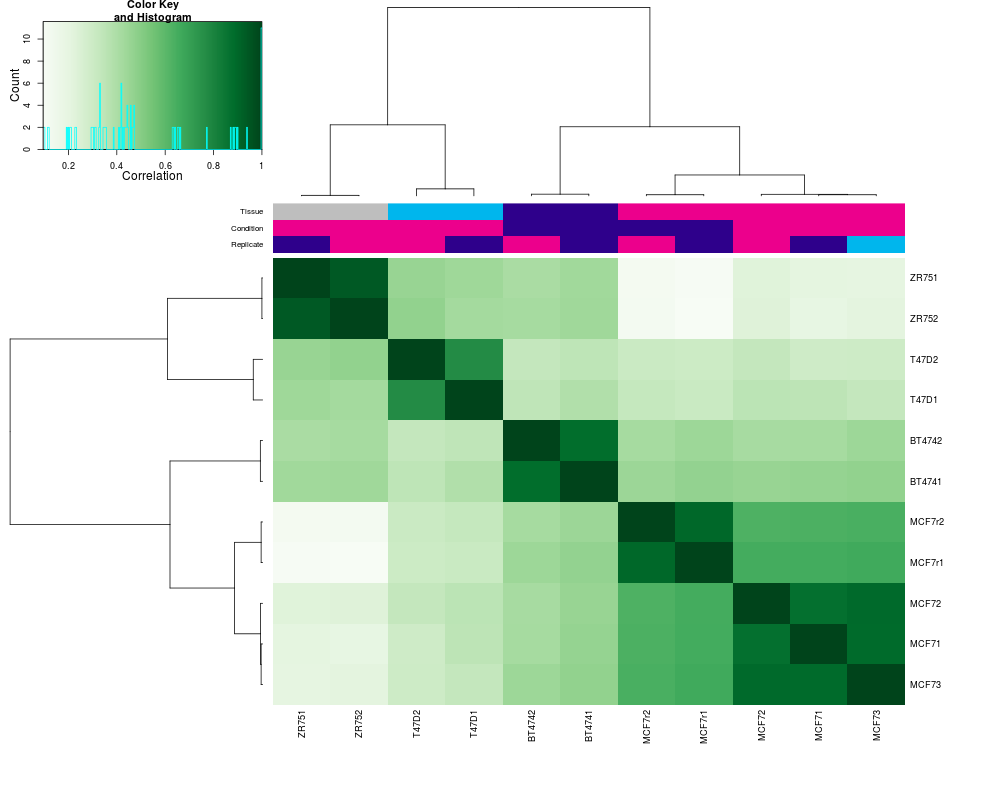
Draw a binding site heatmapDescriptionDraws a binding site heatmap Usage
dba.plotHeatmap(DBA, attributes=DBA$attributes, maxSites=1000, minval, maxval,
                contrast, method=DBA$config$AnalysisMethod,
                th=DBA$config$th, bUsePval=DBA$config$bUsePval,
                report, score, bLog=TRUE, mask, sites, sortFun,
                correlations=TRUE, olPlot=DBA_COR,
                ColAttributes,RowAttributes, colSideCols, rowSideCols=colSideCols,
                margin=10, colScheme="Greens", distMethod="pearson",
                ...)
Arguments
DetailsMODE: Correlation Heatmap plot using statistics for global binding matrix: dba.plotHeatmap(DBA, attributes=DBA$attributes, minval, maxval, correlations, olPlot, colScheme="Greens", distMethod="pearson", ...) MODE: Correlation Heatmap plot using statistics for significantly differentially bound sites: dba.plotHeatmap(DBA, attributes=DBA$attributes, minval, maxval, contrast, method=DBA_DESEQ2, th=0.05, bUsePval=F, mask, overlaps, olPlot=DBA_COR, colScheme="Greens", distMethod="pearson", ...) MODE: Binding heatmap plot using significantly differentially bound sites: dba.plotHeatmap(DBA, attributes, maxSites, minval, maxval, contrast, method, th, bUsePval, correlations=FALSE, colScheme, distMethod, ...) MODE: Binding heatmap plot using the global binding matrix: dba.plotHeatmap(DBA, attributes, maxSites, minval, maxval, mask, sites, correlations=FALSE, sortFun, colScheme, distMethod, ...) Valueif correlations is not if correlations is Author(s)Rory Stark See Also
Examples
data(tamoxifen_peaks)
# peak overlap correlation heatmap
dba.plotHeatmap(tamoxifen)

data(tamoxifen_counts)
# counts correlation heatmap
dba.plotHeatmap(tamoxifen)

data(tamoxifen_analysis)
#correlation heatmap based on all normalized data
dba.plotHeatmap(tamoxifen,contrast=1,th=1)

#correlation heatmap based on DB sites only
dba.plotHeatmap(tamoxifen,contrast=1)

#binding heatmap based on DB sites
dba.plotHeatmap(tamoxifen,contrast=1,correlations=FALSE)

#binding heatmap based on 1,000 sites with highest variance
sites <- dba.plotHeatmap(tamoxifen,contrast=1,th=1,
                         correlations=FALSE,sortFun=var)
sites

data(tamoxifen_counts)
#Examples of  heatmaps using DB sites with different subsets of samples
#exclude T47D
tamoxifen <- dba.contrast(tamoxifen,tamoxifen$masks$Resistant,c(3:5,10:11))
tamoxifen <- dba.analyze(tamoxifen,bCorPlot=FALSE)
# regular heatmaps with two contrast groups
dba.plotHeatmap(tamoxifen, contrast=1)
#also include the T47D samples
dba.plotHeatmap(tamoxifen,contrast=1,mask=tamoxifen$masks$All)
#correlation heatmap without MCF7
plot(tamoxifen,contrast=1,mask=!tamoxifen$masks$MCF7)
# binding heatmap using only the MCF7 samples
dba.plotHeatmap(tamoxifen,contrast=1,mask=tamoxifen$masks$MCF7,correlations=FALSE)
Results
R version 3.3.1 (2016-06-21) -- "Bug in Your Hair"
Copyright (C) 2016 The R Foundation for Statistical Computing
Platform: x86_64-pc-linux-gnu (64-bit)

R is free software and comes with ABSOLUTELY NO WARRANTY.
You are welcome to redistribute it under certain conditions.
Type 'license()' or 'licence()' for distribution details.

R is a collaborative project with many contributors.
Type 'contributors()' for more information and
'citation()' on how to cite R or R packages in publications.

Type 'demo()' for some demos, 'help()' for on-line help, or
'help.start()' for an HTML browser interface to help.
Type 'q()' to quit R.

> library(DiffBind)
Loading required package: GenomicRanges
Loading required package: BiocGenerics
Loading required package: parallel

Attaching package: 'BiocGenerics'

The following objects are masked from 'package:parallel':

    clusterApply, clusterApplyLB, clusterCall, clusterEvalQ,
    clusterExport, clusterMap, parApply, parCapply, parLapply,
    parLapplyLB, parRapply, parSapply, parSapplyLB

The following objects are masked from 'package:stats':

    IQR, mad, xtabs

The following objects are masked from 'package:base':

    Filter, Find, Map, Position, Reduce, anyDuplicated, append,
    as.data.frame, cbind, colnames, do.call, duplicated, eval, evalq,
    get, grep, grepl, intersect, is.unsorted, lapply, lengths, mapply,
    match, mget, order, paste, pmax, pmax.int, pmin, pmin.int, rank,
    rbind, rownames, sapply, setdiff, sort, table, tapply, union,
    unique, unsplit

Loading required package: S4Vectors
Loading required package: stats4

Attaching package: 'S4Vectors'

The following objects are masked from 'package:base':

    colMeans, colSums, expand.grid, rowMeans, rowSums

Loading required package: IRanges
Loading required package: GenomeInfoDb
Loading required package: SummarizedExperiment
Loading required package: Biobase
Welcome to Bioconductor

    Vignettes contain introductory material; view with
    'browseVignettes()'. To cite Bioconductor, see
    'citation("Biobase")', and for packages 'citation("pkgname")'.


> png(filename="/home/ddbj/snapshot/RGM3/R_BC/result/DiffBind/dba.plotHeatmap.Rd_%03d_medium.png", width=480, height=480)
> ### Name: dba.plotHeatmap
> ### Title: Draw a binding site heatmap
> ### Aliases: dba.plotHeatmap
>
> ### ** Examples
>
> data(tamoxifen_peaks)
> # peak overlap correlation heatmap
> dba.plotHeatmap(tamoxifen)
>
> data(tamoxifen_counts)
> # counts correlation heatmap
> dba.plotHeatmap(tamoxifen)
>
> data(tamoxifen_analysis)
> #correlation heatmap based on all normalized data
> dba.plotHeatmap(tamoxifen,contrast=1,th=1)
>
> #correlation heatmap based on DB sites only
> dba.plotHeatmap(tamoxifen,contrast=1)
>
> #binding heatmap based on DB sites
> dba.plotHeatmap(tamoxifen,contrast=1,correlations=FALSE)
>
> #binding heatmap based on 1,000 sites with highest variance
> sites <- dba.plotHeatmap(tamoxifen,contrast=1,th=1,
+                          correlations=FALSE,sortFun=var)
> sites
GRanges object with 1000 ranges and 11 metadata columns:
       seqnames               ranges strand |            BT4742
          <Rle>            <IRanges>  <Rle> |         <numeric>
  1394    chr18 [37893179, 37893679]      * |   5.6655328175932
   914    chr18 [24642724, 24643224]      * |  4.55005560017327
  1150    chr18 [31592697, 31593197]      * |  6.13501810089442
  1368    chr18 [37115976, 37116476]      * |  4.90369255478797
  1272    chr18 [34100800, 34101300]      * |  6.40249841175941
   ...      ...                  ...    ... .               ...
   707    chr18 [20424038, 20424538]      * | 0.380130598730957
  1903    chr18 [51217759, 51218259]      * | 0.380130598730957
  1228    chr18 [33102434, 33102934]      * | 0.380130598730957
  2390    chr18 [62103300, 62103800]      * | 0.380130598730957
  1966    chr18 [52596076, 52596576]      * | 0.380130598730957
                  BT4741           MCF7r1           MCF7r2            MCF71
               <numeric>        <numeric>        <numeric>        <numeric>
  1394  4.85121369798651 1.70652043730863 2.74486545709392 1.00169390113662
   914  5.41309258559462 3.29148293802979 2.15990295637277 1.00169390113662
  1150  6.15933599334884 2.29148293802979 1.15990295637277 1.00169390113662
  1368  4.85121369798651 0.70652043730863 3.15990295637277 2.58665640185778
  1272  6.21378377737121 0.70652043730863 3.15990295637277 1.00169390113662
   ...               ...              ...              ...              ...
   707 0.458896275207745 0.70652043730863 2.15990295637277 1.00169390113662
  1903 0.458896275207745 0.70652043730863 2.15990295637277 1.00169390113662
  1228 0.458896275207745 0.70652043730863 1.15990295637277 1.00169390113662
  2390 0.458896275207745 0.70652043730863 1.15990295637277 1.00169390113662
  1966 0.458896275207745 0.70652043730863 1.15990295637277 1.00169390113662
                   MCF73            MCF72             ZR751            ZR752
               <numeric>        <numeric>         <numeric>        <numeric>
  1394 0.550628427645601  3.2040744803403 0.464373801530046 2.40877635240219
   914   1.5506284276456 3.52600257522766  1.20133939569625 2.26675734752976
  1150  2.13559092836676 2.78903698106145   2.0493363022512 2.76632835702027
  1368   2.5506284276456  1.2040744803403                 0 1.10921607054328
  1272   1.5506284276456 2.78903698106145  0.87941130080889                0
   ...               ...              ...               ...              ...
   707 0.550628427645601  1.2040744803403  3.68676622286649 3.69417857126444
  1903 0.550628427645601  1.2040744803403  4.30567605551099 4.26675734752976
  1228 0.550628427645601  1.2040744803403   3.0493363022512 3.47486554285996
  2390 0.550628427645601  1.2040744803403  2.68676622286649 2.83504110710429
  1966 0.550628427645601  1.2040744803403  2.78630189641741 3.05263254217691
                  T47D2            T47D1
              <numeric>        <numeric>
  1394  2.8869596780919 2.61850034530758
   914 3.37238650526214 1.61850034530758
  1150 3.73495658464685 1.61850034530758
  1368 3.47192217881305 1.61850034530758
  1272  2.8869596780919 4.78842534674989
   ...              ...              ...
   707 4.51922789359141 4.42585526736518
  1903 4.60942570256299  5.5253909409161
  1228 4.20888777297926 4.42585526736518
  2390 3.73495658464685 3.94042844019494
  1966  3.9573490059833 4.20346284602874
  -------
  seqinfo: 1 sequence from an unspecified genome; no seqlengths
>
> data(tamoxifen_counts)
> #Examples of  heatmaps using DB sites with different subsets of samples
> #exclude T47D
> tamoxifen <- dba.contrast(tamoxifen,tamoxifen$masks$Resistant,c(3:5,10:11))
> tamoxifen <- dba.analyze(tamoxifen,bCorPlot=FALSE)
converting counts to integer mode
gene-wise dispersion estimates
mean-dispersion relationship
final dispersion estimates
> # regular heatmaps with two contrast groups
> dba.plotHeatmap(tamoxifen, contrast=1)
> #also include the T47D samples
> dba.plotHeatmap(tamoxifen,contrast=1,mask=tamoxifen$masks$All)
> #correlation heatmap without MCF7
> plot(tamoxifen,contrast=1,mask=!tamoxifen$masks$MCF7)
> # binding heatmap using only the MCF7 samples
> dba.plotHeatmap(tamoxifen,contrast=1,mask=tamoxifen$masks$MCF7,correlations=FALSE)
>
>
>
>
>
>
> dev.off()
null device
          1
>
|