Supported by Dr. Osamu Ogasawara and  . . |
|
Last data update: 2014.03.03 |
Massart Inequality Plot FunctionDescriptionCreates a Massart inequality plot for testing the empirical distribution and distribution function based on an inequality due to Massart (1990). Usage
distIneqMassartPlot(densFn = "norm", param = NULL,
                    nSamp = 50, n = 100, ...)
Arguments
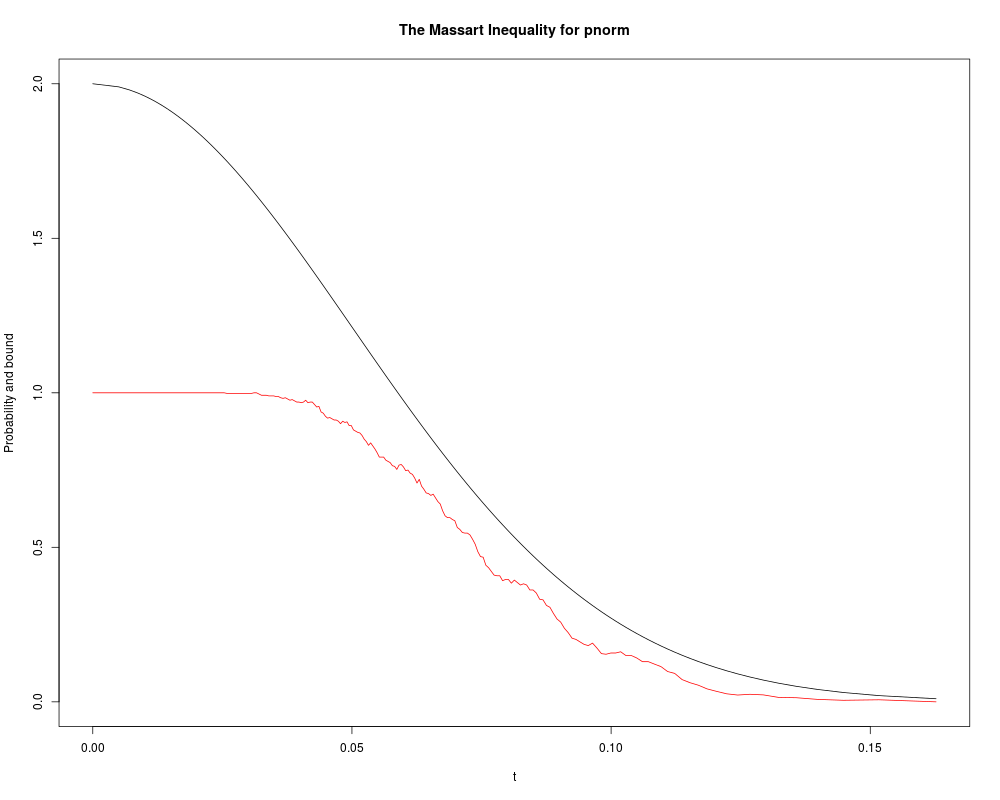
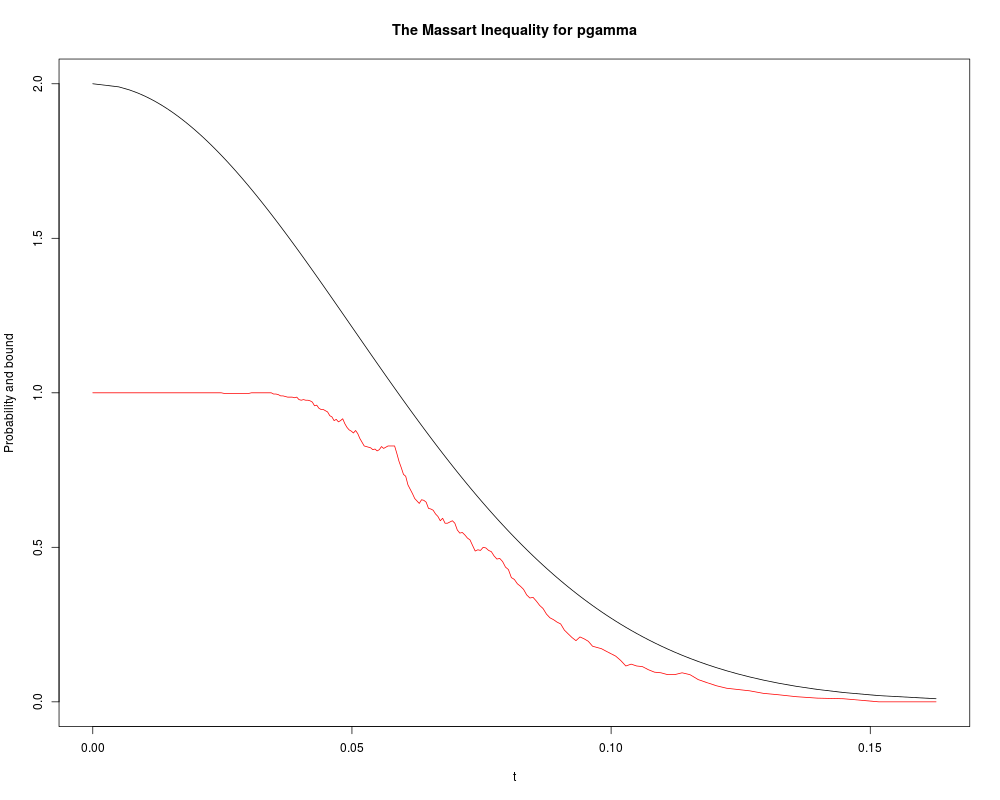
DetailsMassart (1990) gave a version of the Dvoretsky-Kiefer-Wolfowitz inequality with the best possible constant: P(sup_x|F_n(x)-F(x)|> t) <= 2exp(-2nt^2) where F_n is the empirical distribution function for a sample of n independent and identically distributed random variables with distribution function F. This inequality is true for all distribution functions, for all n and t. The red curve in the plot shows the LHS probabilities and the black curve gives the RHS bound. The red curve should lie below the black curve in order that the empirical distribution represents a sample from the theoretical distribution. ValueReturns Author(s)David Scott d.scott@auckland.ac.nz, Xinxing Li xli053@aucklanduni.ac.nz ReferencesMassart P. (1990) The tight constant in the Dvoretsky-Kiefer-Wolfovitz inequality. Ann. Probab., 18, 1269–1283. Examples
### The Massart Inequality plot for standard Normal Distribution
distIneqMassartPlot()

### The Massart Inequality plot for Gamma Distribution
distIneqMassartPlot("gamma", shape = 1)
Results
R version 3.3.1 (2016-06-21) -- "Bug in Your Hair"
Copyright (C) 2016 The R Foundation for Statistical Computing
Platform: x86_64-pc-linux-gnu (64-bit)

R is free software and comes with ABSOLUTELY NO WARRANTY.
You are welcome to redistribute it under certain conditions.
Type 'license()' or 'licence()' for distribution details.

R is a collaborative project with many contributors.
Type 'contributors()' for more information and
'citation()' on how to cite R or R packages in publications.

Type 'demo()' for some demos, 'help()' for on-line help, or
'help.start()' for an HTML browser interface to help.
Type 'q()' to quit R.

> library(DistributionUtils)
Loading required package: RUnit
> png(filename="/home/ddbj/snapshot/RGM3/R_CC/result/DistributionUtils/distIneqMassartPlot.Rd_%03d_medium.png", width=480, height=480)
> ### Name: distIneqMassartPlot
> ### Title: Massart Inequality Plot Function
> ### Aliases: distIneqMassartPlot
> ### Keywords: distribution univar
>
> ### ** Examples
>
> ### The Massart Inequality plot for standard Normal Distribution
> distIneqMassartPlot()
>
> ### The Massart Inequality plot for Gamma Distribution
> distIneqMassartPlot("gamma", shape = 1)
>
>
>
>
>
> dev.off()
null device
          1
>
|