Supported by Dr. Osamu Ogasawara and  . . |
|
Last data update: 2014.03.03 |
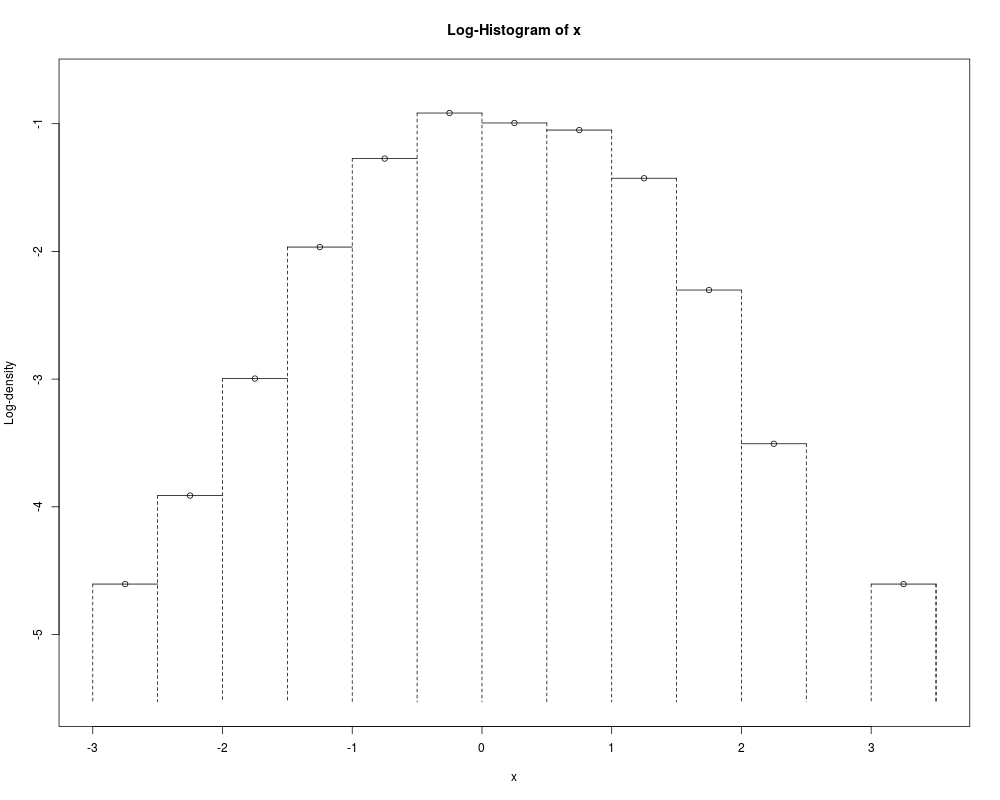
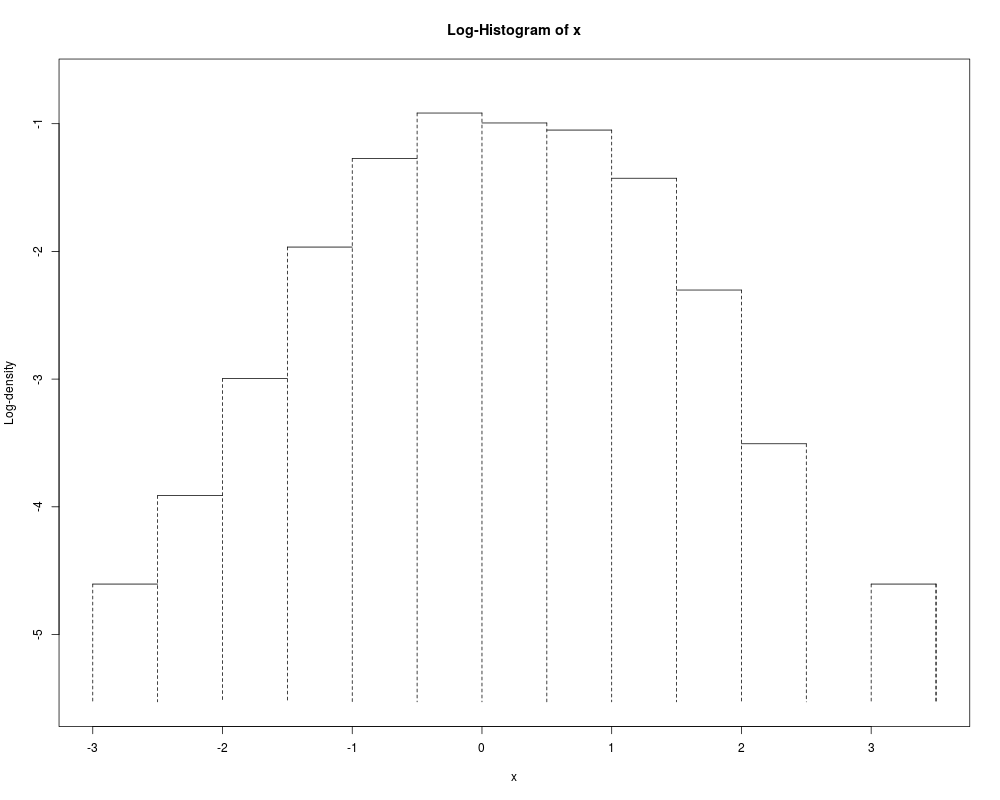
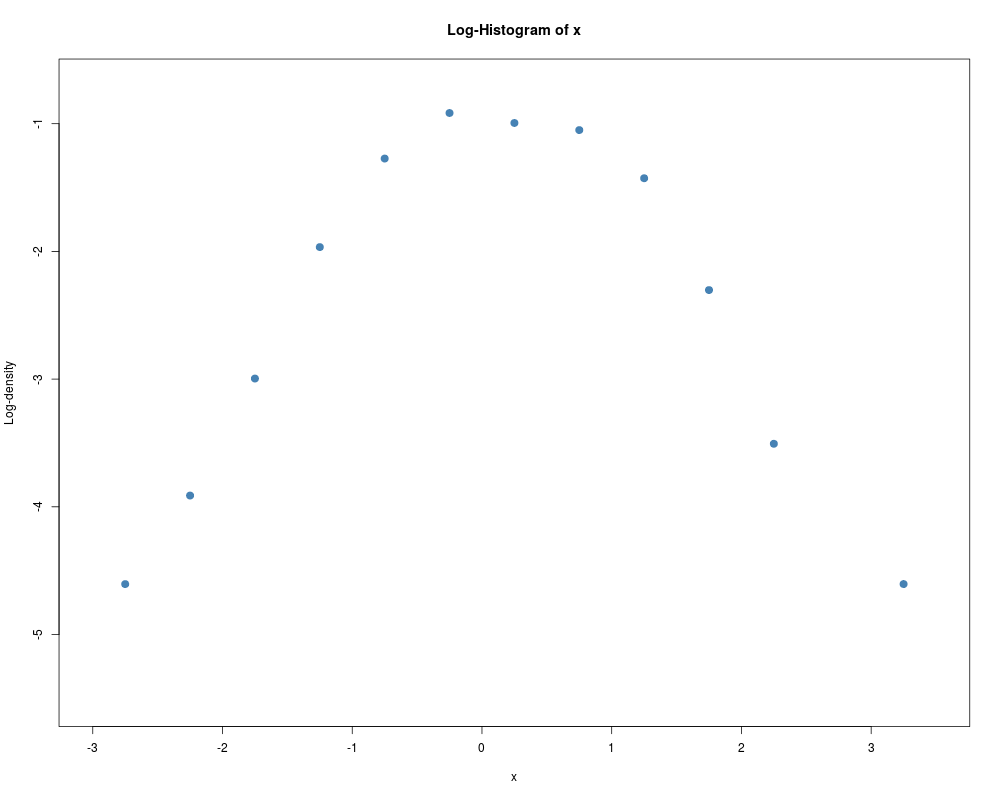
Plot Log-HistogramDescriptionPlots a log-histogram, as in for example Feiller, Flenley and Olbricht (1992). The intended use of the log-histogram is to examine the fit of a particular density to a set of data, as an alternative to a histogram with a density curve. For this reason, only the log-density histogram is implemented, and it is not possible to obtain a log-frequency histogram. The log-histogram can be plotted with histogram-like dashed vertical bars, or as points marking the tops of the log-histogram bars, or with both bars and points. Usage
  logHist(x, breaks = "Sturges",
          include.lowest = TRUE, right = TRUE,
          main = paste("Log-Histogram of", xName),
          xlim = range(breaks), ylim = NULL, xlab = xName,
          ylab = "Log-density", nclass = NULL, htype = "b", ...)
Arguments
DetailsUses To calculate A log-histogram in the form used by Feiller, Flenley and Olbricht (1992) is plotted. See also Barndorff-Nielsen (1977) for use of log-histograms. ValueReturns a list with components:
Author(s)David Scott d.scott@auckland.ac.nz, Richard Trendall, Thomas Tran ReferencesBarndorff-Nielsen, O. (1977) Exponentially decreasing distributions for the logarithm of particle size, Proc. Roy. Soc. Lond., A353, 401–419. Barndorff-Nielsen, O. and Bl<c3><a6>sild, P (1983). Hyperbolic distributions. In Encyclopedia of Statistical Sciences, eds., Johnson, N. L., Kotz, S. and Read, C. B., Vol. 3, pp. 700–707. New York: Wiley. Fieller, N. J., Flenley, E. C. and Olbricht, W. (1992) Statistics of particle size data. Appl. Statist., 41, 127–146. See Also
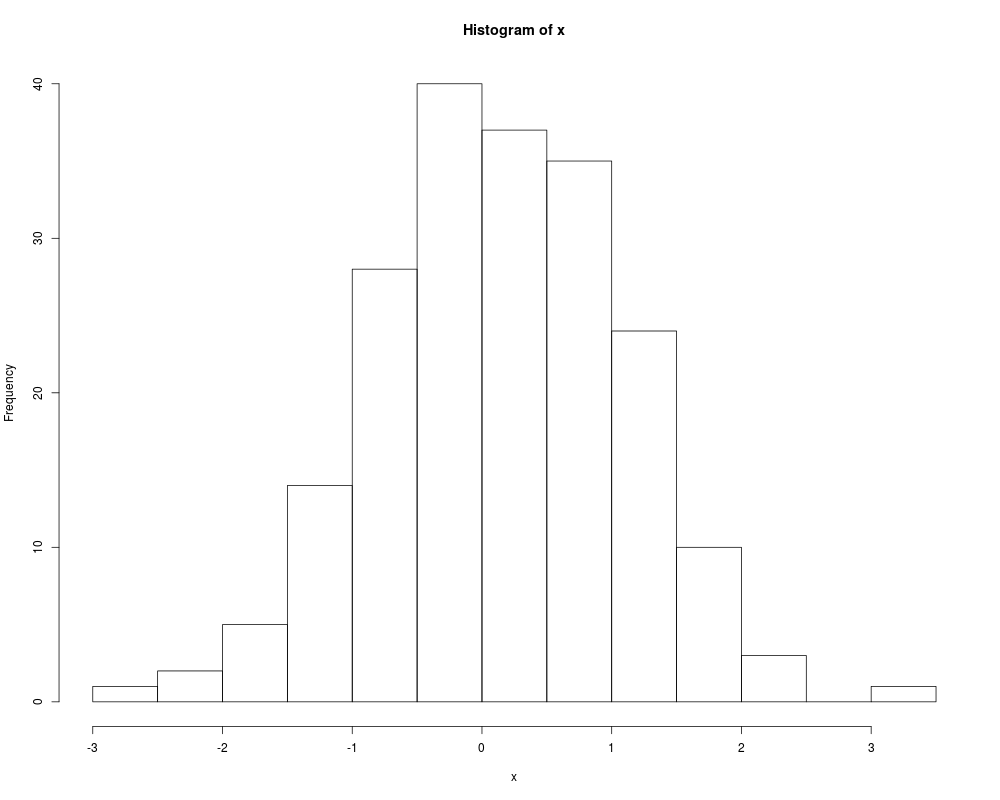
Examplesx <- rnorm(200) hist(x) ### default logHist(x) ### log histogram only logHist(x, htype = "h") ### points only, some options logHist(x, htype = "p", pch = 20, cex = 2, col = "steelblue") Results
R version 3.3.1 (2016-06-21) -- "Bug in Your Hair"
Copyright (C) 2016 The R Foundation for Statistical Computing
Platform: x86_64-pc-linux-gnu (64-bit)

R is free software and comes with ABSOLUTELY NO WARRANTY.
You are welcome to redistribute it under certain conditions.
Type 'license()' or 'licence()' for distribution details.

R is a collaborative project with many contributors.
Type 'contributors()' for more information and
'citation()' on how to cite R or R packages in publications.

Type 'demo()' for some demos, 'help()' for on-line help, or
'help.start()' for an HTML browser interface to help.
Type 'q()' to quit R.

> library(DistributionUtils)
Loading required package: RUnit
> png(filename="/home/ddbj/snapshot/RGM3/R_CC/result/DistributionUtils/logHist.Rd_%03d_medium.png", width=480, height=480)
> ### Name: logHist
> ### Title: Plot Log-Histogram
> ### Aliases: logHist
> ### Keywords: hplot distribution
>
> ### ** Examples
>
> x <- rnorm(200)
> hist(x)
> ### default
> logHist(x)
> ### log histogram only
> logHist(x, htype = "h")
> ### points only, some options
> logHist(x, htype = "p", pch = 20, cex = 2, col = "steelblue")
>
>
>
>
>
> dev.off()
null device
          1
>
|