Supported by Dr. Osamu Ogasawara and  . . |
|
Last data update: 2014.03.03 |
Function to estimate end-member scores uncertaintyDescriptionThe function uses either existing assemblages of end-member loadings or specified measures of centrality and dispersion as input for Monte Carlo runs to estimate the influence of different end-member loadings on end-member scores. Likewise, the influence of the weight limit quantiles (l) can be estimated. UsageMqs.uncertainty(X, q, l, c, rotation = "Varimax", Vqn, Vqn.sd, runs, type.l, autocorrelation, ...) Arguments
ValueA list with numeric vector and matrix objects.
Author(s)Michael Dietze, Elisabeth Dietze ReferencesDietze E, Hartmann K, Diekmann B, IJmker J, Lehmkuhl F, Opitz S,
Stauch G, Wuennemann B, Borchers A. 2012. An end-member algorithm for
deciphering modern detrital processes from lake sediments of Lake Donggi
Cona, NE Tibetan Plateau, China. Sedimentary Geology 243-244: 169-180. See Also
Examples
## load example data set
data(X, envir = environment())
## set model run parameters
q = 3 # set number of end-members, try 4 to see the difference!
Vqn <- EMMA(X, q)$Vqn # assign unscaled end-member loadings
Vqn.sd <- Vqn * 0.2 # assign a relative standard deviation of 20 %
l.1 <- 0.2 # set l to 0.2
l.2 <- c(0.2, 0.08) # set l to mean = 0.2 and sd = 0.08
runs <- 12 # senseless value to increase computation speed
## EXAMPLE 1
## Calculate Mqs uncertainty
M <- Mqs.uncertainty(X = X,
q = q,
l = l.1,
runs = runs,
Vqn = Vqn,
Vqn.sd = Vqn.sd,
type.l = "rnorm",
autocorrelation = 3)
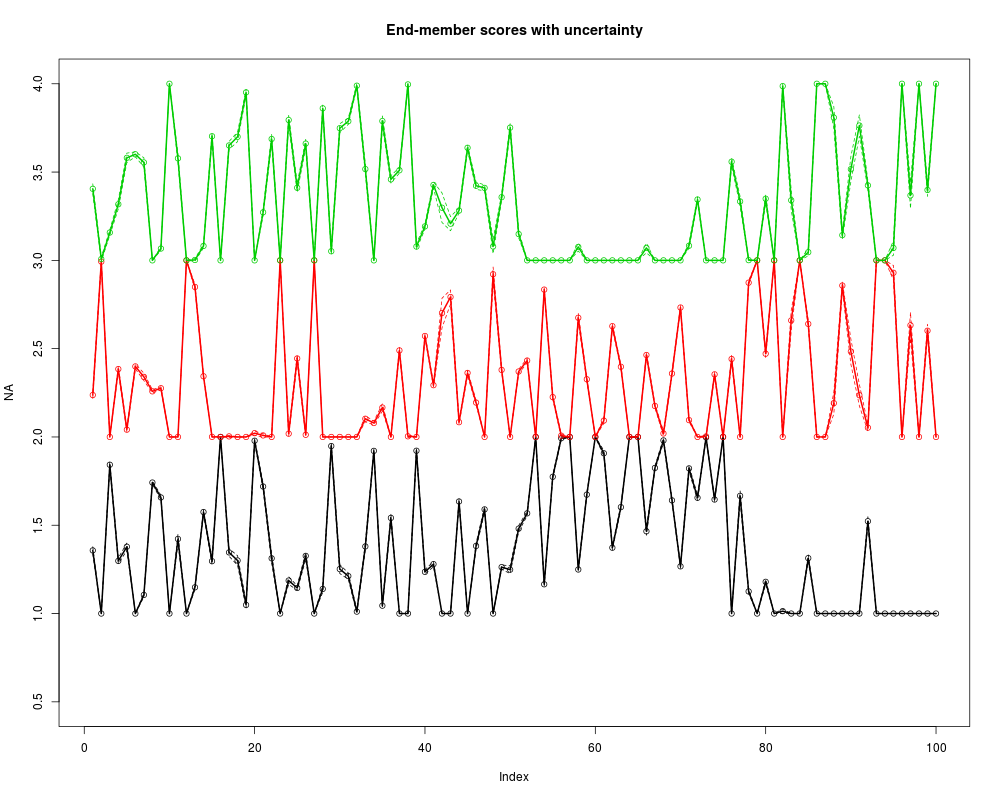
## Plot line-point graph with means and standard deviations
plot(NA,
xlim = c(1, nrow(X)),
ylim = c(0.5, q + 1),
main = "End-member scores with uncertainty")
for(i in 1:q) {
lines(1:nrow(X), M$mean[,i] - M$sd[,i] + i, col = i, lty = 2)
lines(1:nrow(X), M$mean[,i] + i, col = i, lwd = 2)
points(1:nrow(X), M$mean[,i] + i, col = i)
lines(1:nrow(X), M$mean[,i] + M$sd[,i] + i, col = i, lty = 2)
}
## EXAMPLE 2
## Calculate Mqs uncertainty
M <- Mqs.uncertainty(X = X,
q = q,
l = l.2,
runs = runs,
Vqn = Vqn,
type.l = "rnorm")
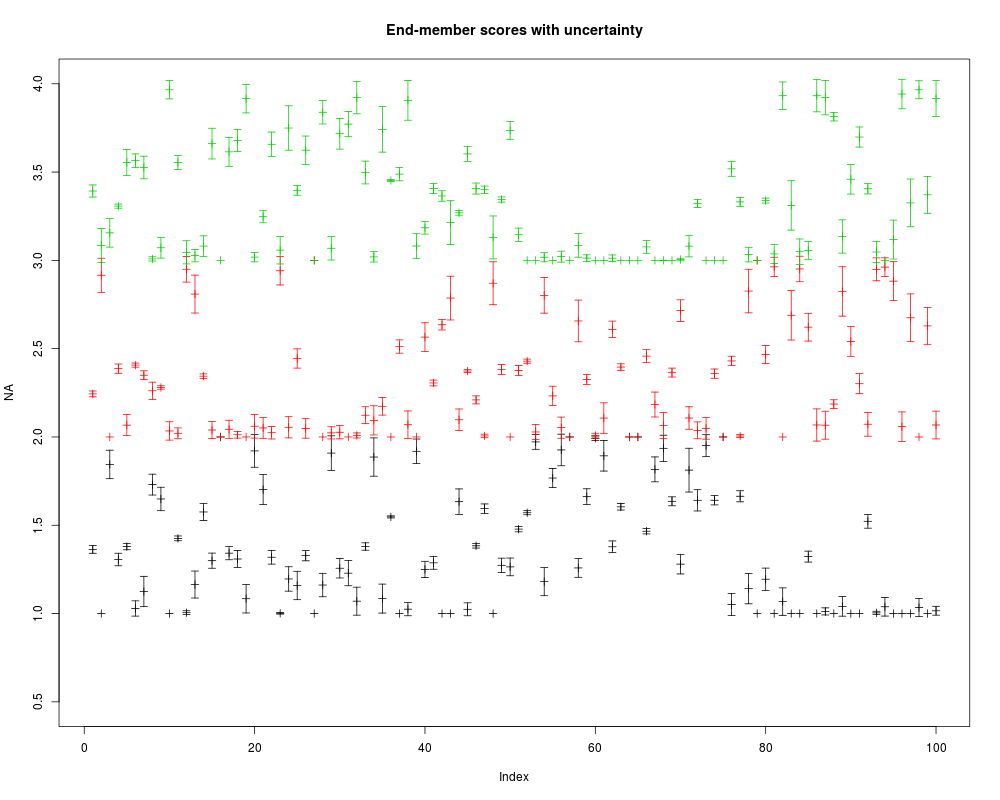
## Plot point graph with error bars
plot(NA,
xlim = c(1, nrow(X)),
ylim = c(0.5, q + 1),
main = "End-member scores with uncertainty")
for(i in 1:q) {
points(1:nrow(X), M$mean[,i] + i, pch = 3, col = i)
arrows(1:nrow(X), M$mean[,i] - M$sd[,i] + i,
1:nrow(X), M$mean[,i] + M$sd[,i] + i,
code = 3, angle = 90, length = 0.05, col = i)
}
Results
R version 3.3.1 (2016-06-21) -- "Bug in Your Hair"
Copyright (C) 2016 The R Foundation for Statistical Computing
Platform: x86_64-pc-linux-gnu (64-bit)

R is free software and comes with ABSOLUTELY NO WARRANTY.
You are welcome to redistribute it under certain conditions.
Type 'license()' or 'licence()' for distribution details.

R is a collaborative project with many contributors.
Type 'contributors()' for more information and
'citation()' on how to cite R or R packages in publications.

Type 'demo()' for some demos, 'help()' for on-line help, or
'help.start()' for an HTML browser interface to help.
Type 'q()' to quit R.

> library(EMMAgeo)
Loading required package: GPArotation
Loading required package: limSolve
Loading required package: shape
Loading required package: shiny
> png(filename="/home/ddbj/snapshot/RGM3/R_CC/result/EMMAgeo/Mqs.uncertainty.Rd_%03d_medium.png", width=480, height=480)
> ### Name: Mqs.uncertainty
> ### Title: Function to estimate end-member scores uncertainty
> ### Aliases: Mqs.uncertainty
> ### Keywords: EMMA
>
> ### ** Examples
>
> ## load example data set
> data(X, envir = environment())
>
> ## set model run parameters
> q = 3 # set number of end-members, try 4 to see the difference!
> Vqn <- EMMA(X, q)$Vqn # assign unscaled end-member loadings
> Vqn.sd <- Vqn * 0.2 # assign a relative standard deviation of 20 %
> l.1 <- 0.2 # set l to 0.2
> l.2 <- c(0.2, 0.08) # set l to mean = 0.2 and sd = 0.08
> runs <-  12 # senseless value to increase computation speed
>
> ## EXAMPLE 1
> ## Calculate Mqs uncertainty
> M <- Mqs.uncertainty(X = X,
+                      q = q,
+                      l = l.1,
+                      runs = runs,
+                      Vqn = Vqn,
+                      Vqn.sd = Vqn.sd,
+                      type.l = "rnorm",
+                      autocorrelation = 3)
>
> ## Plot line-point graph with means and standard deviations
> plot(NA,
+      xlim = c(1, nrow(X)),
+      ylim = c(0.5, q + 1),
+      main = "End-member scores with uncertainty")
> for(i in 1:q) {
+   lines(1:nrow(X), M$mean[,i] - M$sd[,i] + i, col = i, lty = 2)
+   lines(1:nrow(X), M$mean[,i] + i, col = i, lwd = 2)
+   points(1:nrow(X), M$mean[,i] + i, col = i)
+   lines(1:nrow(X), M$mean[,i] + M$sd[,i] + i, col = i, lty = 2)
+ }
>
> ## EXAMPLE 2
> ## Calculate Mqs uncertainty
> M <- Mqs.uncertainty(X = X,
+                      q = q,
+                      l = l.2,
+                      runs = runs,
+                      Vqn = Vqn,
+                      type.l = "rnorm")
>
> ## Plot point graph with error bars
> plot(NA,
+      xlim = c(1, nrow(X)),
+      ylim = c(0.5, q + 1),
+      main = "End-member scores with uncertainty")
> for(i in 1:q) {
+   points(1:nrow(X), M$mean[,i] + i, pch = 3, col = i)
+   arrows(1:nrow(X), M$mean[,i] - M$sd[,i] + i,
+          1:nrow(X), M$mean[,i] + M$sd[,i] + i,
+          code = 3, angle = 90, length = 0.05, col = i)
+ }
There were 32 warnings (use warnings() to see them)
>
>
>
>
>
> dev.off()
null device
          1
>
|