a formula, such as y ~ grp, where y is a
numeric vector of data values to be split into groups according to
the grouping variable grp (usually a factor).
weights
case weights, vector of the same length as
the dependent variable in formula or the variable given as arguments)
data
a data.frame (or list) from which the variables in
formula should be taken.
subset
an optional vector specifying a subset of observations
to be used for plotting.
na.action
a function which indicates what should happen
when the data contain NAs. The default is to ignore missing
values in either the response or the group.
x
for specifying data from which the boxplots are to be
produced. Either a numeric vector, or a single list containing such
vectors. Additional unnamed arguments specify further data
as separate vectors (each corresponding to a component boxplot).
NAs are allowed in the data.
...
For the formula method, named arguments to be passed to
the default method.
For the default method, unnamed arguments are additional data
vectors (unless x is a list when they are ignored),
and named arguments are arguments and graphical parameters to be
passed to bxp in addition to the ones
given by argument pars (and override those in pars).
range
this determines how far the plot whiskers extend out
from the box. If range is positive, the whiskers extend
to the most extreme data point which is no more than
range times the interquartile range from the box. A value
of zero causes the whiskers to extend to the data extremes.
width
a vector giving the relative widths of the boxes making
up the plot.
varwidth
if varwidth is TRUE, the boxes are
drawn with widths proportional to the square-roots of the number
of observations in the groups.
notch
if notch is TRUE, a notch is drawn in
each side of the boxes. If the notches of two plots do not
overlap this is ‘strong evidence’ that the two medians differ
(Chambers et al., 1983, p. 62). See boxplot.stats
for the calculations used.
outline
if outline is not true, the outliers are
not drawn (as points whereas S+ uses lines).
names
group labels which will be printed under each boxplot.
Can be a character vector or an expression (see
plotmath).
boxwex
a scale factor to be applied to all boxes. When there
are only a few groups, the appearance of the plot can be improved
by making the boxes narrower.
staplewex
staple line width expansion, proportional to box
width.
outwex
outlier line width expansion, proportional to box
width.
plot
if TRUE (the default) then a boxplot is
produced. If not, the summaries which the boxplots are based on
are returned.
border
an optional vector of colors for the outlines of the
boxplots. The values in border are recycled if the
length of border is less than the number of plots.
col
if col is non-null it is assumed to contain colors
to be used to colour the bodies of the box plots. By default they
are in the background colour.
log
character indicating if x or y or both coordinates should
be plotted in log scale.
pars
a list of (potentially many) more graphical parameters,
e.g., boxwex or outpch; these are passed to
bxp (if plot is true); for details, see there.
horizontal
logical indicating if the boxplots should be
horizontal; default FALSE means vertical boxes.
add
logical, if true add boxplot to current plot.
at
numeric vector giving the locations where the boxplots should
be drawn, particularly when add = TRUE;
defaults to 1:n where n is the number of boxes.
Details
The generic function wtd.boxplot currently has a default method
(wtd.boxplot.default) and a formula interface (wtd.boxplot.formula).
If multiple groups are supplied either as multiple arguments or via a
formula, parallel boxplots will be plotted, in the order of the
arguments or the order of the levels of the factor (see
factor).
Missing values are ignored when forming boxplots.
Value
List with the following components:
stats
a matrix, each column contains the extreme of the lower
whisker, the lower hinge, the median, the upper hinge and the
extreme of the upper whisker for one group/plot. If all the inputs
have the same class attribute, so will this component.
n
a vector with the number of observations in each group.
conf
a matrix where each column contains the lower and upper
extremes of the notch.
out
the values of any data points which lie beyond the
extremes of the whiskers.
group
a vector of the same length as out whose elements
indicate to which group the outlier belongs.
R version 3.3.1 (2016-06-21) -- "Bug in Your Hair"
Copyright (C) 2016 The R Foundation for Statistical Computing
Platform: x86_64-pc-linux-gnu (64-bit)
R is free software and comes with ABSOLUTELY NO WARRANTY.
You are welcome to redistribute it under certain conditions.
Type 'license()' or 'licence()' for distribution details.
R is a collaborative project with many contributors.
Type 'contributors()' for more information and
'citation()' on how to cite R or R packages in publications.
Type 'demo()' for some demos, 'help()' for on-line help, or
'help.start()' for an HTML browser interface to help.
Type 'q()' to quit R.
> library(ENmisc)
Loading required package: Hmisc
Loading required package: lattice
Loading required package: survival
Loading required package: Formula
Loading required package: ggplot2
Attaching package: 'Hmisc'
The following objects are masked from 'package:base':
format.pval, round.POSIXt, trunc.POSIXt, units
Loading required package: vcd
Loading required package: grid
Loading required package: RColorBrewer
> png(filename="/home/ddbj/snapshot/RGM3/R_CC/result/ENmisc/wtd.boxplot.Rd_%03d_medium.png", width=480, height=480)
> ### Name: wtd.boxplot
> ### Title: Box Plots with weighted cases
> ### Aliases: wtd.boxplot wtd.boxplot.default wtd.boxplot.formula
> ### Keywords: ~kwd1 hplot
>
> ### ** Examples
>
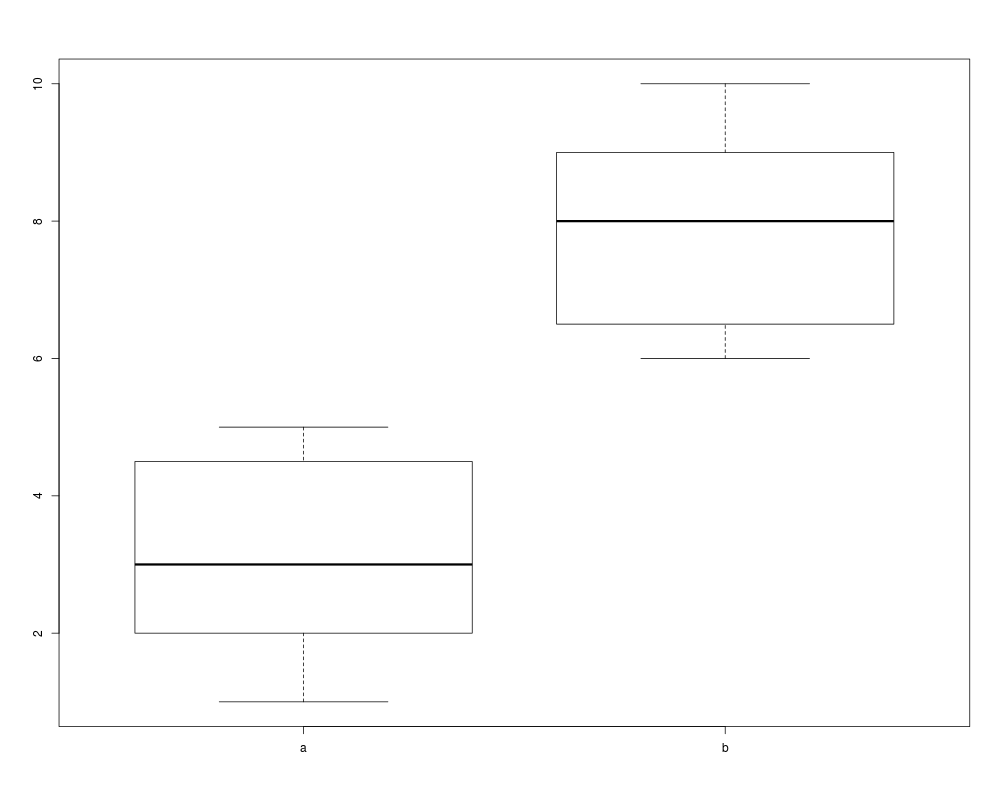
> x<-1:10
> fc<-rep(c("a","b"),each=5)
> wt<-c(6:10,10:6)
> wtd.boxplot(x~fc,weights=wt)
>
>
>
>
>
> dev.off()
null device
1
>
 .
.