Supported by Dr. Osamu Ogasawara and  . . |
|
Last data update: 2014.03.03 |
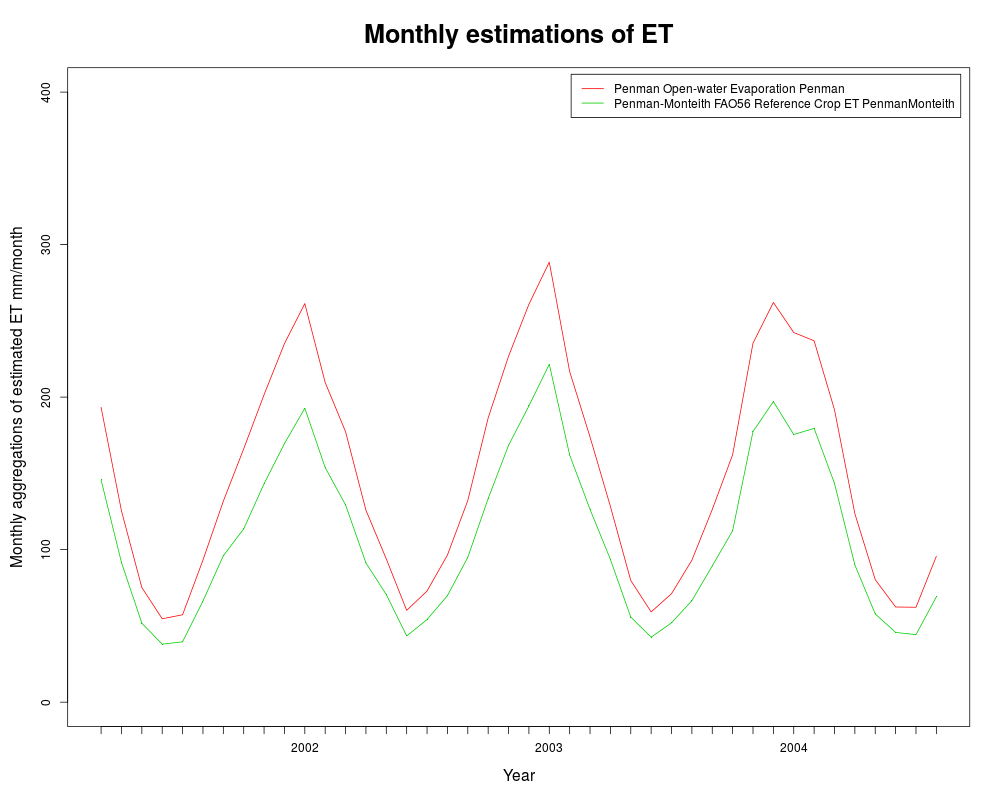
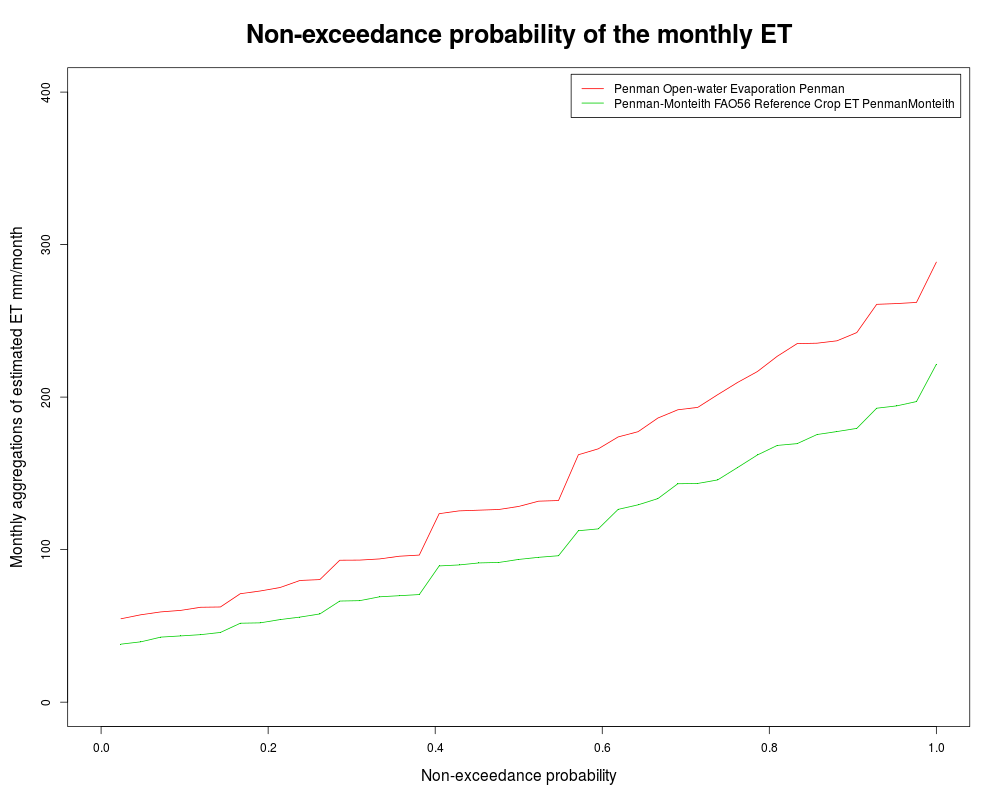
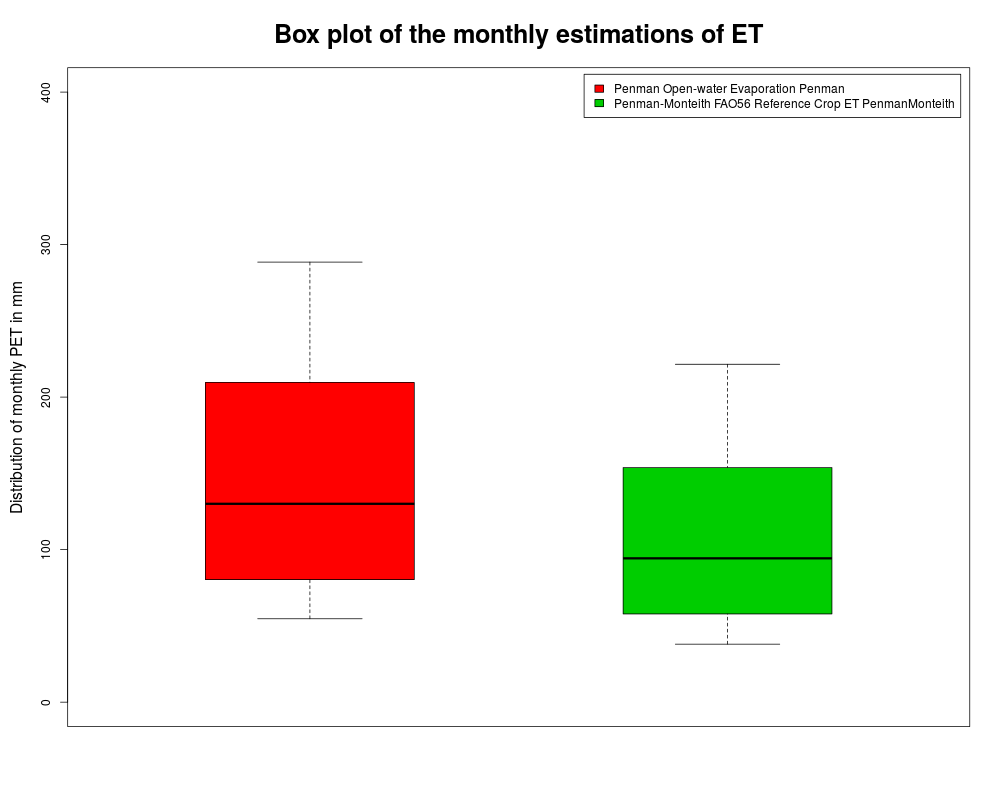
Compare esimtated evapotranspiration among multiple sets of resultDescriptionProduce comparison plots for results and statistics from different estimations produced by using different formulations and/or different input data. The number of different sets of results can be between 2 and 7. Plotting type can be selected among daily aggregation, monthly aggregation, annual aggregation, monthly average and annual average. For each type three comparison plots will be produced including time series, non-exceedance probability and box plot. UsageETComparison(results1, results2, results3 = NULL, results4 = NULL, results5 = NULL, results6 = NULL, results7 = NULL, labs, Sdate = NULL, Edate = NULL, type = "Monthly", ylim = rep(NA,2)) Arguments
ValueThree plots are generated for each type of comparison plot selected, including: Author(s)Danlu Guo See Also
Examples
# Use processed existing data set and constants from kent Town, Adelaide
data("processeddata")
data("constants")

# Call ET.Penman under the generic function ET
results_Penman <- ET.Penman(data, constants, ts="daily", solar="sunshine hours",
wind="yes", windfunction_ver = "1948", alpha = 0.08, z0 = 0.001)

# Call ET.PenmanMonteith under the generic function ET
results_PenmanMonteith <- ET.PenmanMonteith(data, constants, ts="daily", solar="sunshine hours",
wind="yes", crop = "short")

# Plot the estimated Penman open-water evaporation against average temperature
ETComparison(results_Penman, results_PenmanMonteith, type = "Monthly", ylim=c(0,400),
labs=c("Penman","PenmanMonteith"))
Results
R version 3.3.1 (2016-06-21) -- "Bug in Your Hair"
Copyright (C) 2016 The R Foundation for Statistical Computing
Platform: x86_64-pc-linux-gnu (64-bit)

R is free software and comes with ABSOLUTELY NO WARRANTY.
You are welcome to redistribute it under certain conditions.
Type 'license()' or 'licence()' for distribution details.

R is a collaborative project with many contributors.
Type 'contributors()' for more information and
'citation()' on how to cite R or R packages in publications.

Type 'demo()' for some demos, 'help()' for on-line help, or
'help.start()' for an HTML browser interface to help.
Type 'q()' to quit R.

> library(Evapotranspiration)
Loading required package: zoo

Attaching package: 'zoo'

The following objects are masked from 'package:base':

    as.Date, as.Date.numeric

> png(filename="/home/ddbj/snapshot/RGM3/R_CC/result/Evapotranspiration/ETComparison.Rd_%03d_medium.png", width=480, height=480)
> ### Name: ETComparison
> ### Title: Compare esimtated evapotranspiration among multiple sets of
> ###   result
> ### Aliases: ETComparison
> ### Keywords: plot climate forcing evapotranspiration
>
> ### ** Examples
>
> # Use processed existing data set and constants from kent Town, Adelaide
> data("processeddata")
> data("constants")
>
> # Call ET.Penman under the generic function ET
> results_Penman <- ET.Penman(data, constants, ts="daily", solar="sunshine hours",
+ wind="yes", windfunction_ver = "1948", alpha = 0.08, z0 = 0.001)
Penman Open-water Evaporation
Evaporative surface: water, albedo = 0.08 ; roughness height = 0.001 m
Sunshine hour data have been used for calculating incoming solar radiation
Wind data have been used for calculating the Penman evaporation. Penman 1948 wind function has been used.
Timestep: daily
Units: mm
Time duration: 2001-03-01 to 2004-08-31
Basic stats
Mean: 4.87
Max: 12.79
Min: 1.04
>
> # Call ET.PenmanMonteith under the generic function ET
> results_PenmanMonteith <- ET.PenmanMonteith(data, constants, ts="daily", solar="sunshine hours",
+ wind="yes", crop = "short")
Penman-Monteith FAO56 Reference Crop ET
Evaporative surface: FAO-56 hypothetical short grass, albedo = 0.23 ; surface resistance = 70 sm^-1; crop height = 0.12  m; roughness height = 0.02 m
Sunshine hour data have been used for calculating incoming solar radiation
Wind data have been used for calculating the reference crop evapotranspiration
Timestep: daily
Units: mm
Time duration: 2001-03-01 to 2004-08-31
1280 ET estimates obtained
Basic stats
Mean: 3.56
Max: 11.06
Min: 0.67
>
> # Plot the estimated Penman open-water evaporation against average temperature
> ETComparison(results_Penman, results_PenmanMonteith, type = "Monthly", ylim=c(0,400),
+ labs=c("Penman","PenmanMonteith"))
>
>
>
>
>
> dev.off()
null device
          1
>
|