Supported by Dr. Osamu Ogasawara and  . . |
|
Last data update: 2014.03.03 |
Plot shapesDescriptionPlot the differences between a set of morphometric shapes and a reference UsagePlotVariations(shapes, reference, path, save = F, w = 6, h = 6, d = 100, c_ref = "red", c_target = "black", s_ref = 3, s_target = 2) Arguments
This parameters are used to modify stored graph (
DetailsThe function uses package ggplot2 (Wickman 2009) to create multiple plots representing the variations between a list of target shapes and a reference (consensus shape or another specimen data). If Author(s)Cabrera Juan Manuel ReferencesH. Wickham. ggplot2: Elegant Graphics for Data Analysis. Springer-Verlag New York, 2009. See Also
Examples
data("aegla_consensus")
data("simulated_shapes")
#Sample one individual from simulated_shapes dataset
simu<-simulated_shapes[100]
#Create a shape variation graphic
graph<-PlotVariations(simu,aegla_consensus)
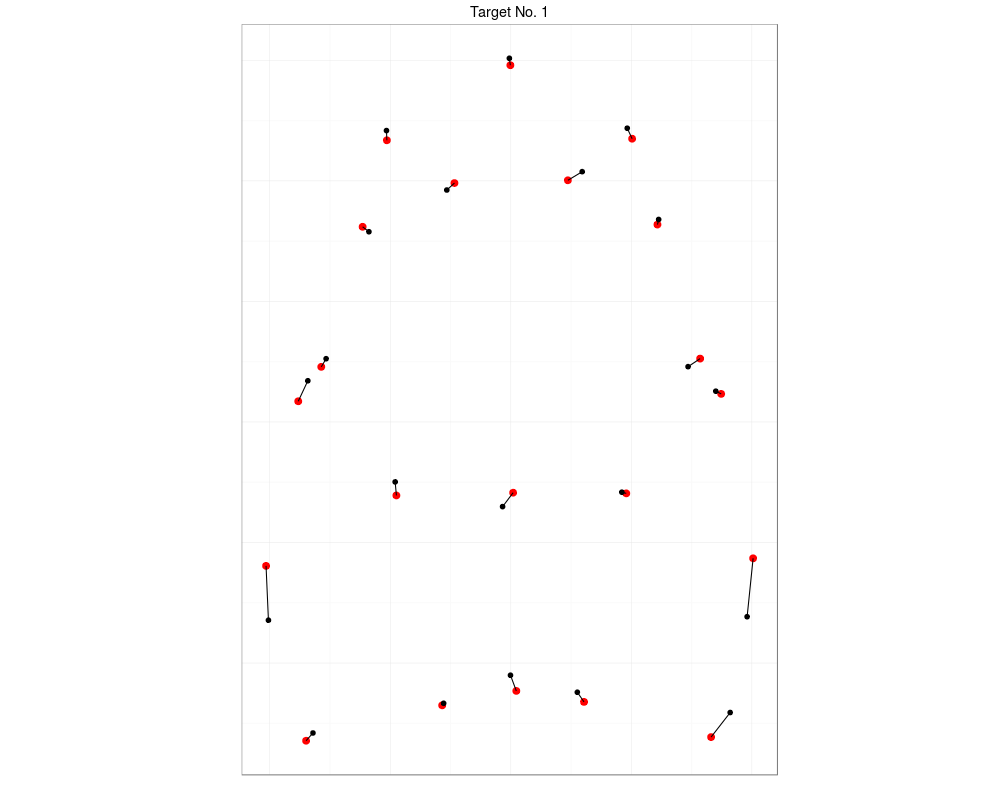
#Red dots represent the landmark coordinates of the reference shape and black
# dots represent the target shape. The length of the segments represent
# distances between pairs of homologous landmarks
graph[[1]]
Results
R version 3.3.1 (2016-06-21) -- "Bug in Your Hair"
Copyright (C) 2016 The R Foundation for Statistical Computing
Platform: x86_64-pc-linux-gnu (64-bit)

R is free software and comes with ABSOLUTELY NO WARRANTY.
You are welcome to redistribute it under certain conditions.
Type 'license()' or 'licence()' for distribution details.

R is a collaborative project with many contributors.
Type 'contributors()' for more information and
'citation()' on how to cite R or R packages in publications.

Type 'demo()' for some demos, 'help()' for on-line help, or
'help.start()' for an HTML browser interface to help.
Type 'q()' to quit R.

> library(Evomorph)
> png(filename="/home/ddbj/snapshot/RGM3/R_CC/result/Evomorph/PlotVariations.Rd_%03d_medium.png", width=480, height=480)
> ### Name: PlotVariations
> ### Title: Plot shapes
> ### Aliases: PlotVariations
>
> ### ** Examples
>
> data("aegla_consensus")
> data("simulated_shapes")
>
> #Sample one individual from simulated_shapes dataset
>
> simu<-simulated_shapes[100]
>
> #Create a shape variation graphic
>
> graph<-PlotVariations(simu,aegla_consensus)
>
> #Red dots represent the landmark coordinates of the reference shape and black
> # dots represent the target shape. The length of the segments represent
> # distances between pairs of homologous landmarks
>
> graph[[1]]
>
>
>
>
>
> dev.off()
null device
          1
>
|