R: Explanation of predictions on instance and model level
explanation
R Documentation
Explanation of predictions on instance and model level
Description
Using general explanation methodology EXPLAIN or IME, the function explainVis explains
predictions of given model and visualizes the explanations.
An explanation of a prediction is given on a level of an individual instance, but aggregation of these explanations
is also possible, which gives a model level explanation. The details are given in the description and references.
Data frame with data, which is used to extract average explanations, discretization,
and other information needed for explanation of instances and model. Typically this is the data set
which was used to train the model.
testData
Data frame with instances which will be explained.
The testData data frame shall contain the same columns as trainData, with possible exception
of target variable, which can be omitted.
visLevel
The level of explanations desired. If visLevel="model" the explanation on the level of model is
generated, meaning that instance level explanations obtained on trainData are aggregated.
If visLevel="instance" one instance level
explanation for each row in testData is generated.
The default value visLevel="both" generates both the model level
as well as all the instance level explanations.
method
The explanation method; two methods are available, EXPLAIN and IME. The EXPLAIN is much faster
and works for any number of attributes in the model,
but cannot explain dependencies expressed disjunctively in the model (for details see references).
The IME can in principle explain any type of dependencies
in the model. It uses sampling based method to avoid exhaustive search for dependencies and
works reasonably fast for up to a few dozen attributes in the model.
problemName
A name of the problem to be written in graph titles. If fileType other than "none" is chosen
the problem name is used as a name of a file name, where graphs are stored. See details section for how title is formed.
dirName
A name of folder where resulting visualization files will be saved if fileType other than "none" is chosen.
fileType
The parameter determines the graphical format of the visualization file.
If fileType="none" (default) visualizations are generated in a
graphical window. Other possible choices are "pdf","eps","emf","jpg","png","bmp","tif" and "tiff".
naMode
For method EXPLAIN this parameter determines how the impact of missing information about certain feature value is
estimated. If naMode="avg", the effect is estimated by the weighted average of predictions
over all possible feature's values.
If naMode="na", the effect is estimated by inserting NA value as feature value.
The "na" method is faster but we are
left to the mercy of adequate treatment of missing values in the function predict for a given model.
explainType
For method EXPLAIN this parameter determines how the prediction with knowledge about
given feature and prediction
without knowledge of this feature are combined into the final explanation.
Values "WE", "infGain", and "predDiff" mean that the difference
is interpreted as weight of evidence, information gain, or plain difference, respectively.
For regression problem only the difference of predictions is available.
classValue
For classification models this parameter determines for which class value the explanations will be generated.
The classValue can be given as a factor, character string or class index.
By default the first class value is chosen.
nLaplace
For EXPLAIN method and classification problems the predicted probabilities are corrected with Laplace correction,
pushing them away from 0 and 1 and towards uniform distribution. Larger values imply smaller effect. The default value is equal
to the number of instances in trainData. The value 0 means that Laplace correction is not used and probabilities
are estimated with relative frequency.
estimator
The name of feature evaluation method used to greedily discretize attributes
when averaging explanation over intervals.
The default value NULL means that "ReliefFexpRank" will be used in classification problems and
"RReliefFexpRank" will be used in regression problems. See discretize for details.
pError
For method IME the estimated probability of an error in explanations. Together with
parameter err this determines the number of needed samples.
err
For method IME the parameter controls the size of tolerable error.
Together with parameter pError this determines the number of needed samples.
See the paper An Efficient Explanation of Individual Classifications using Game Theory for details.
batchSize
For method IME the number of samples processed in batch mode for each explanation. Larger sizes cause
less overhead in processing but may process more samples than required.
maxIter
The maximal number of iterations in IME method allowed for a single explanation.
genType
The type of data generator used to generate random part of instances in method IME.
The generators from package semiArtificial-package are used:
"rf" stands for random forest based generator,
"rbf" invokes RBF network based generator, and
"indAttr" assumes independent attributes and generates values
for each attribute independently.
noAvgBins
For IME method the number of discretization bins used to present model level explanations
and average explanations.
displayAttributes
The vector of attribute names which are visualized in model level visualization.
The default value displayThreshold=NULL displays all attributes and their values.
modelVisCompact
The logical value controlling if attribute values are displayed
in model level visualization. The default value modelVisCompact=FALSE displays all values of
attributes (subject to displayThreshold), and value modelVisCompact=TRUE
displays only contributions on the level of attributes (without their values).
displayThreshold
The threshold value for absolute values of explanations
below which feature contributions are not displayed in instance and model explanation graphs.
The default value displayThreshold=0 displays contributions of all attributes.
normalizeTo
The absolute values of feature contributions are summed and normalized to the value of normalizeTo.
The value common in some areas ( e.g., in medicine) is 100. The default value 0 implies no normalization.
displayColor
The parameter determines if the visualization will be color or grayscale.
noDecimalsInValueName
With how many decimal places will the numeric feature values be presented in visualizations.
The default value is 2.
modelTitle
The value of parameter becomes the title of model level explanation graph. The information contained in problemName, class name and selected classValue
are added to the end of provided character string.
instanceTitle
The value of parameter becomes the title of instance level explanation graph. The information contained in problemName, class name and selected classValue
are added to the end of provided character string.
recall
If parameter is different from NULL, it shall contain the list invisibly returned by one of previous calls to function explainVis. In this case the function reuses already computed explanations,
average explanations, discretization, etc., and only display data differently according to other supplied parameters.
Details
The function explainVis generates explanations and their visualizations given the trained model,
its training data, and data for which we want explanations. This is the frontend explanation function which takes
care of everything, internally calling other functions.
The produced visualizations are output to a graphical device or saved to a file.
If one requires internal information about the explanations, they are returned invisibly.
Separate calls to internal functions (explain, ime,
prepareForExplanations, and explanationAverages are also possible.
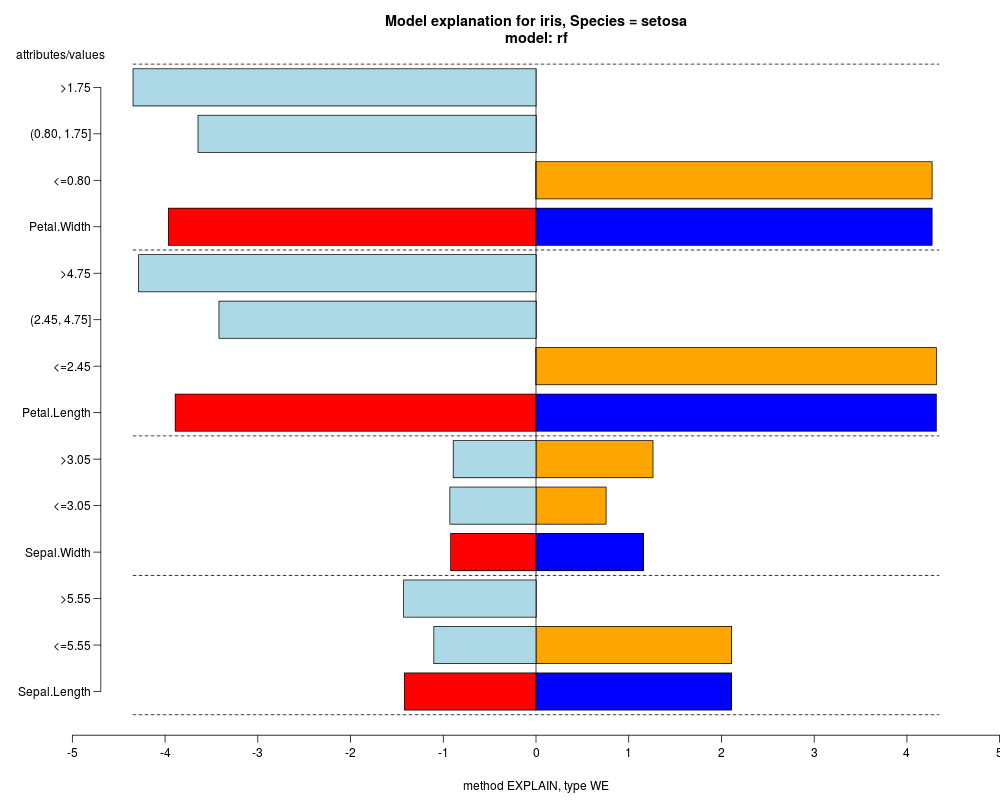
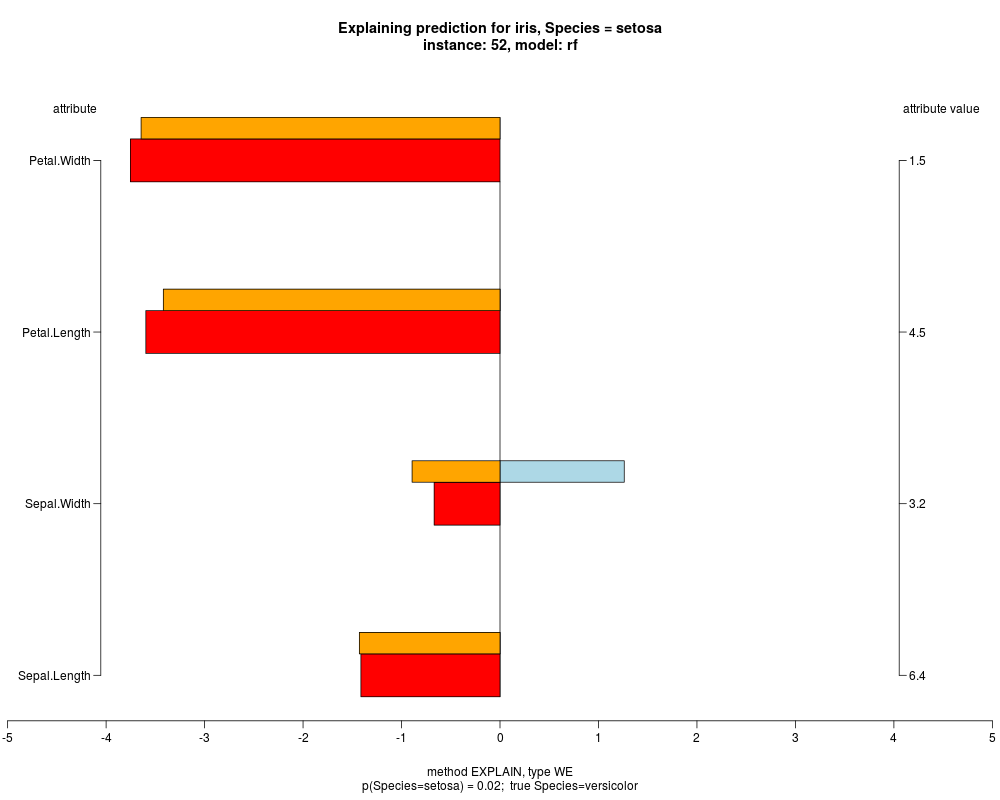
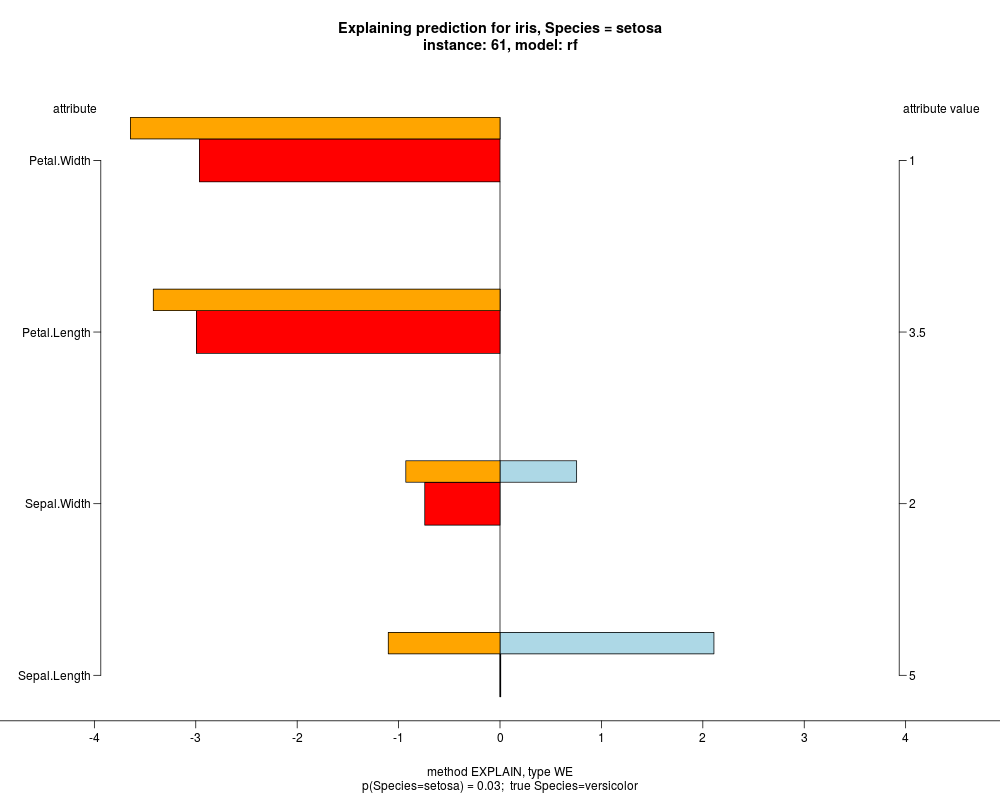
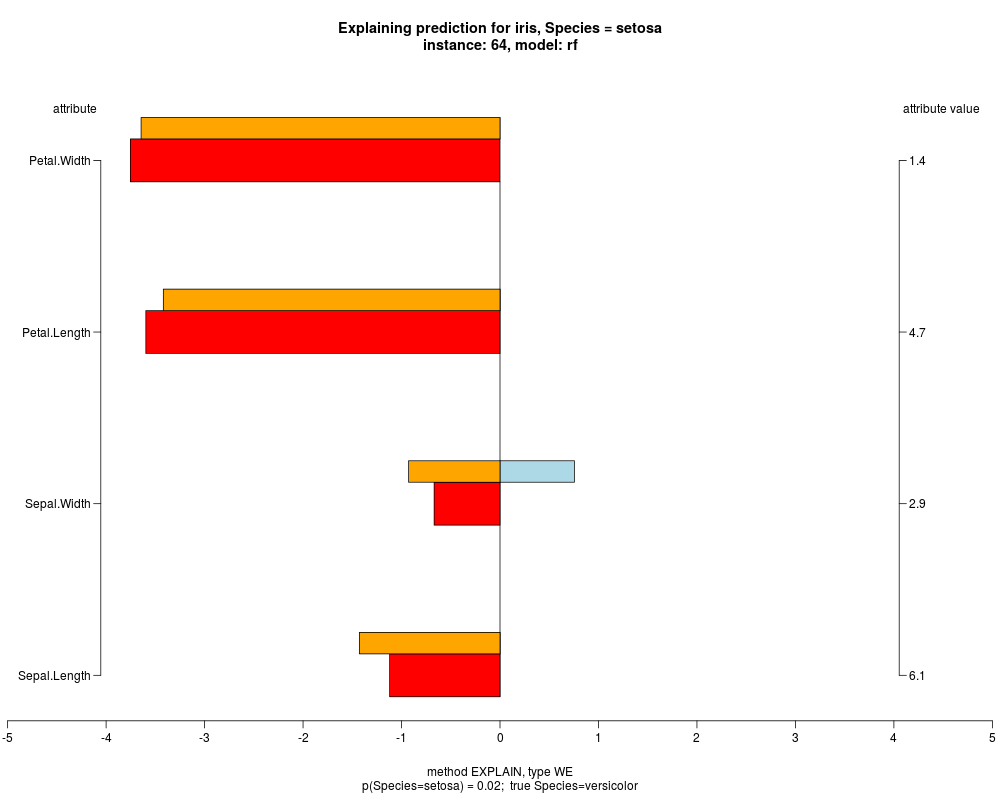
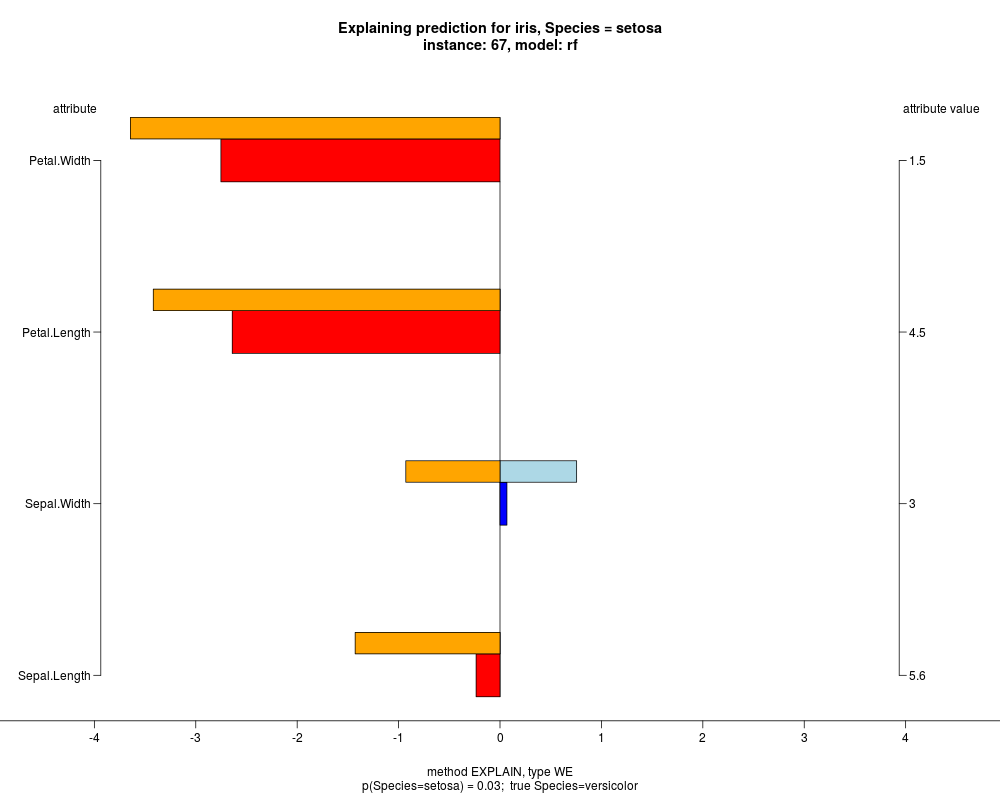
In the model level explanation all feature values of nominal attributes and intervals of numeric attributes are visualized, as
well as weighted summary over all these values.
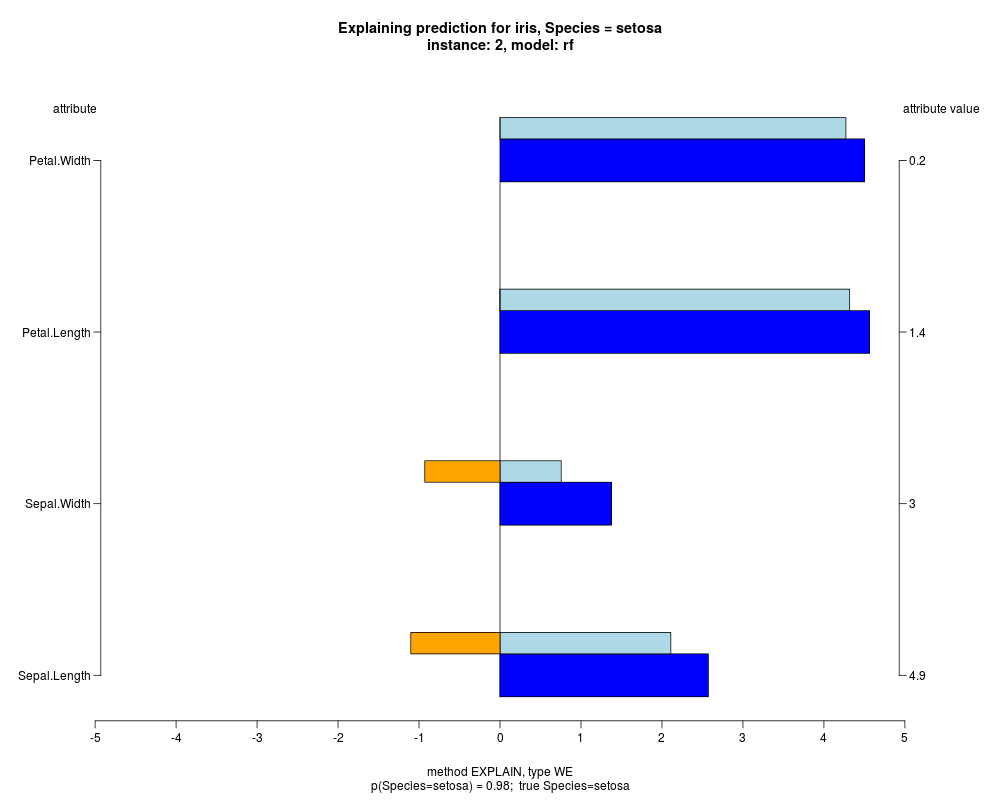
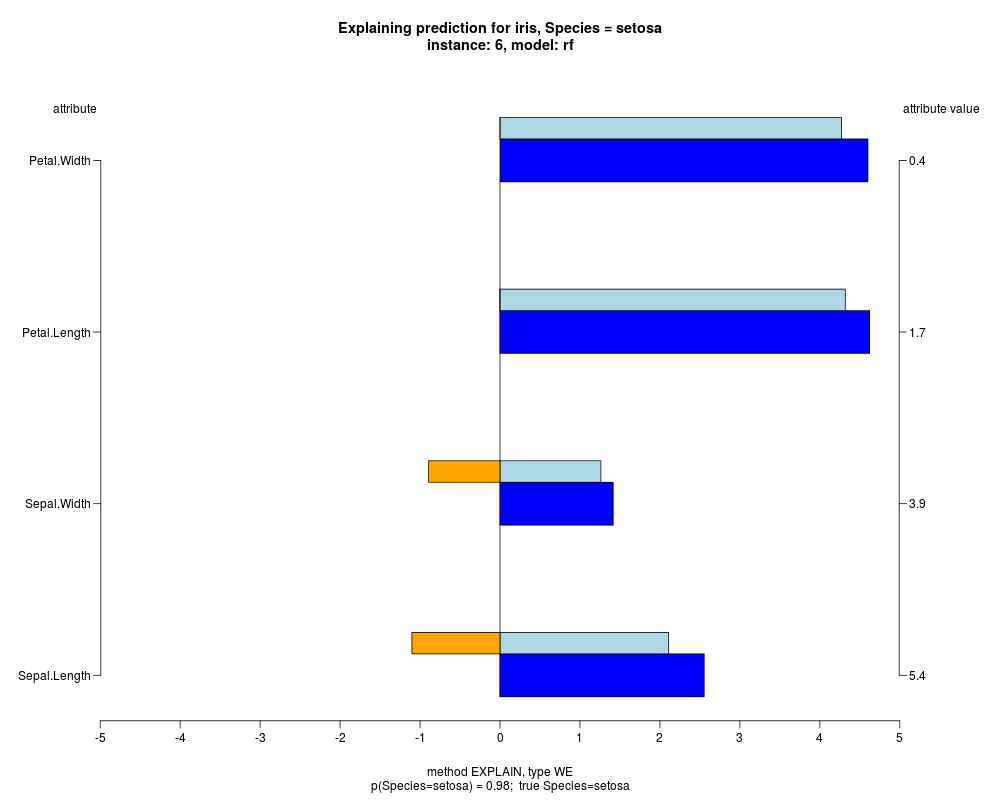
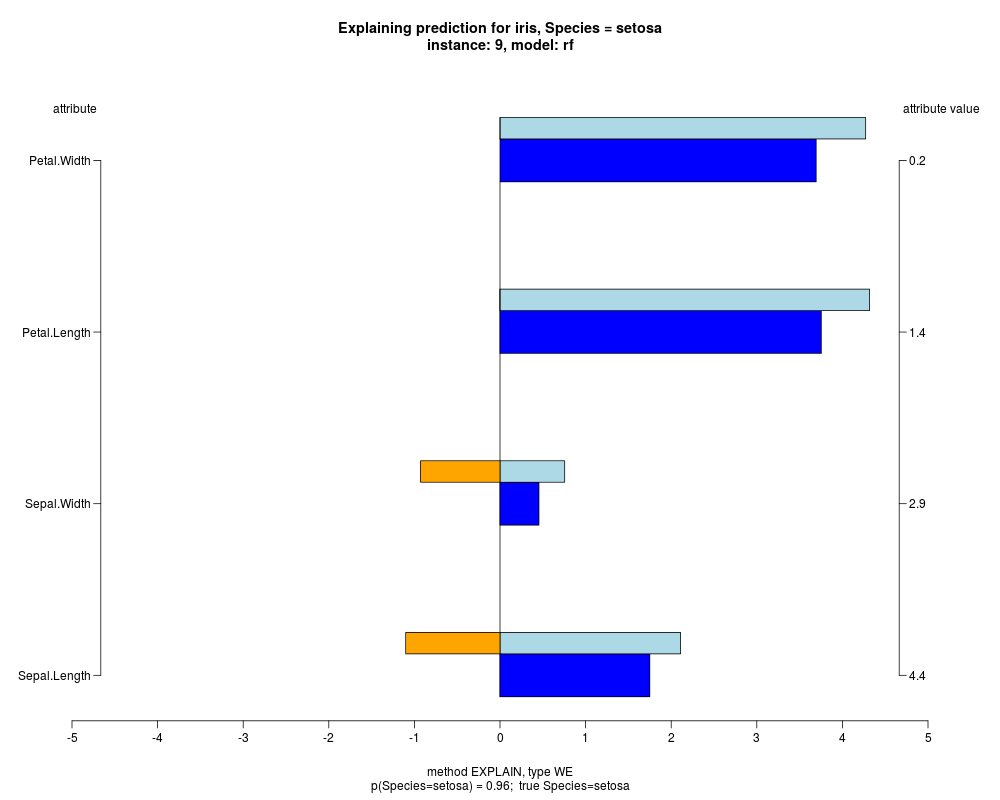
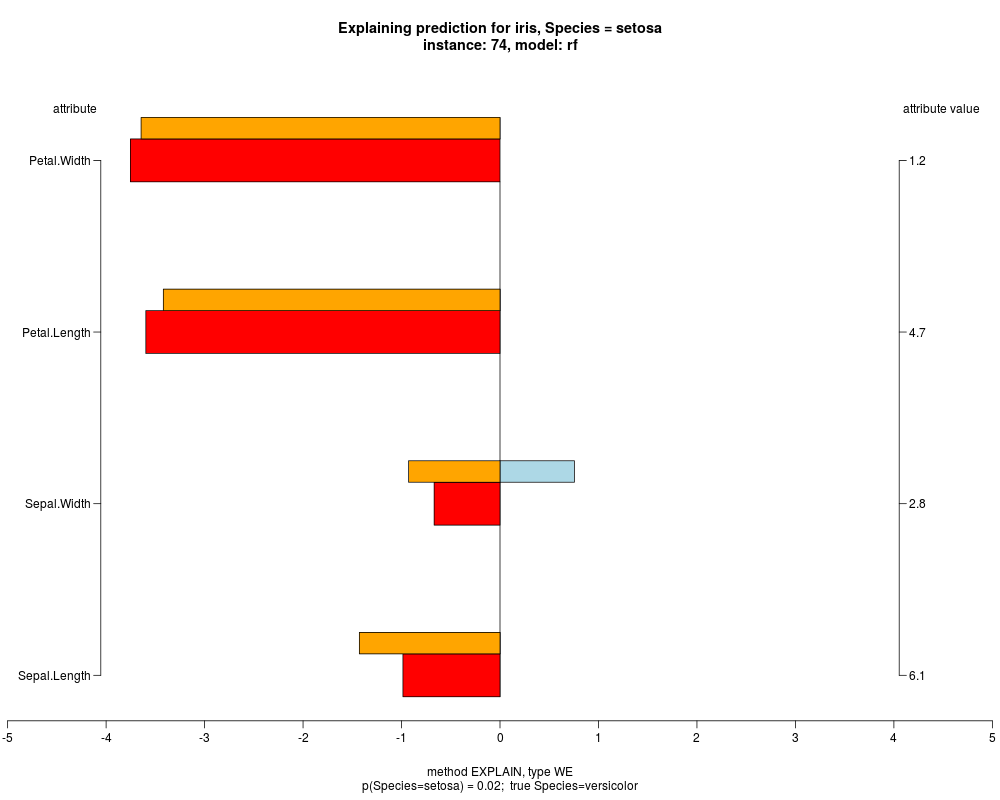
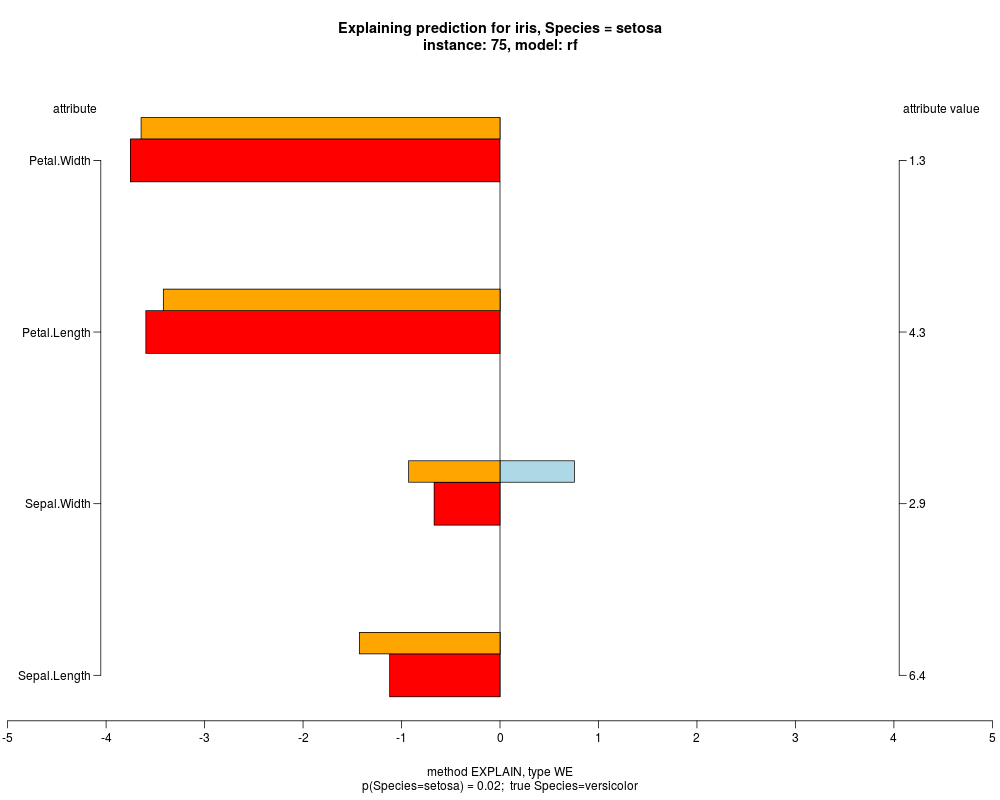
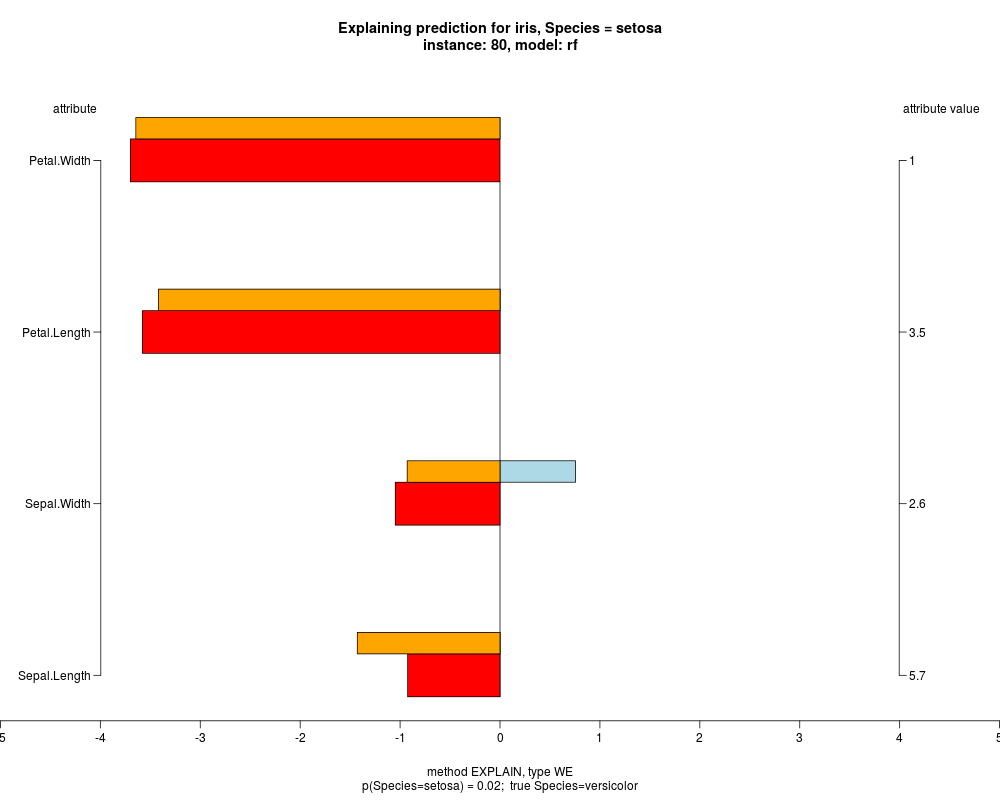
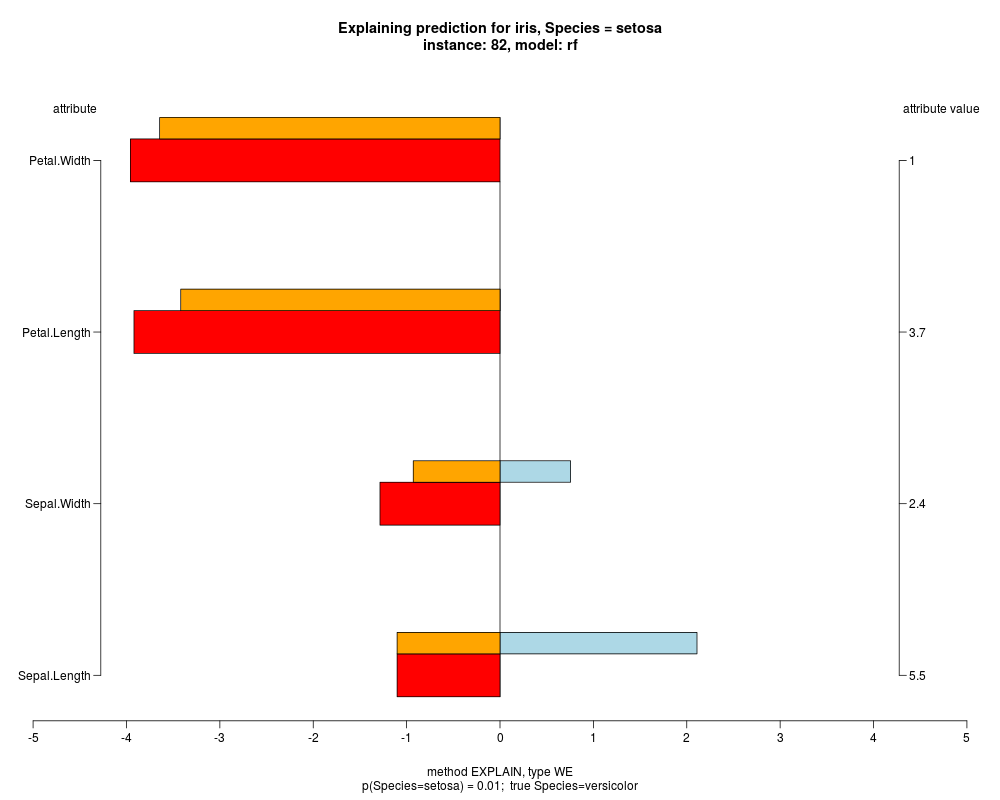
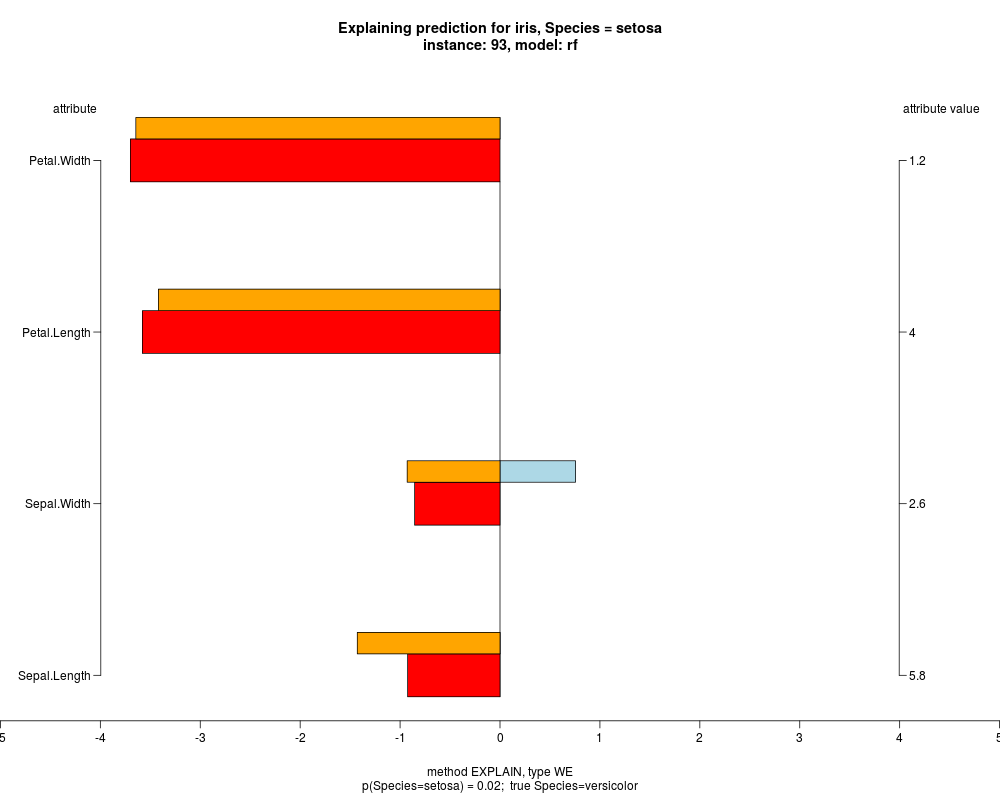
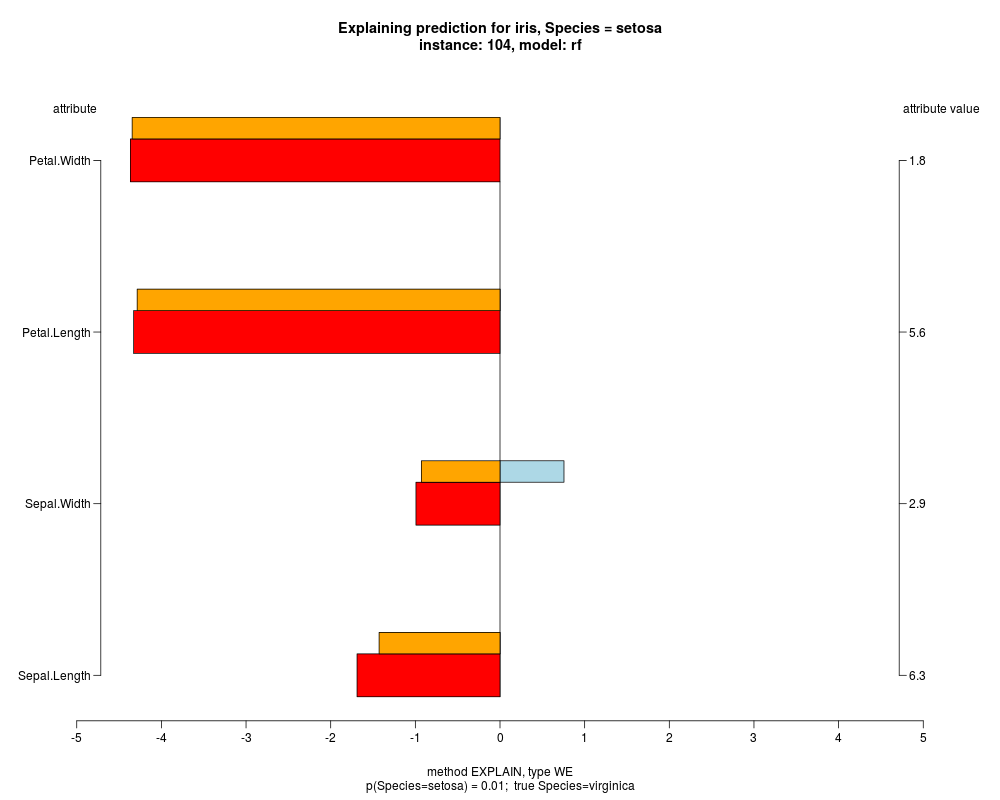
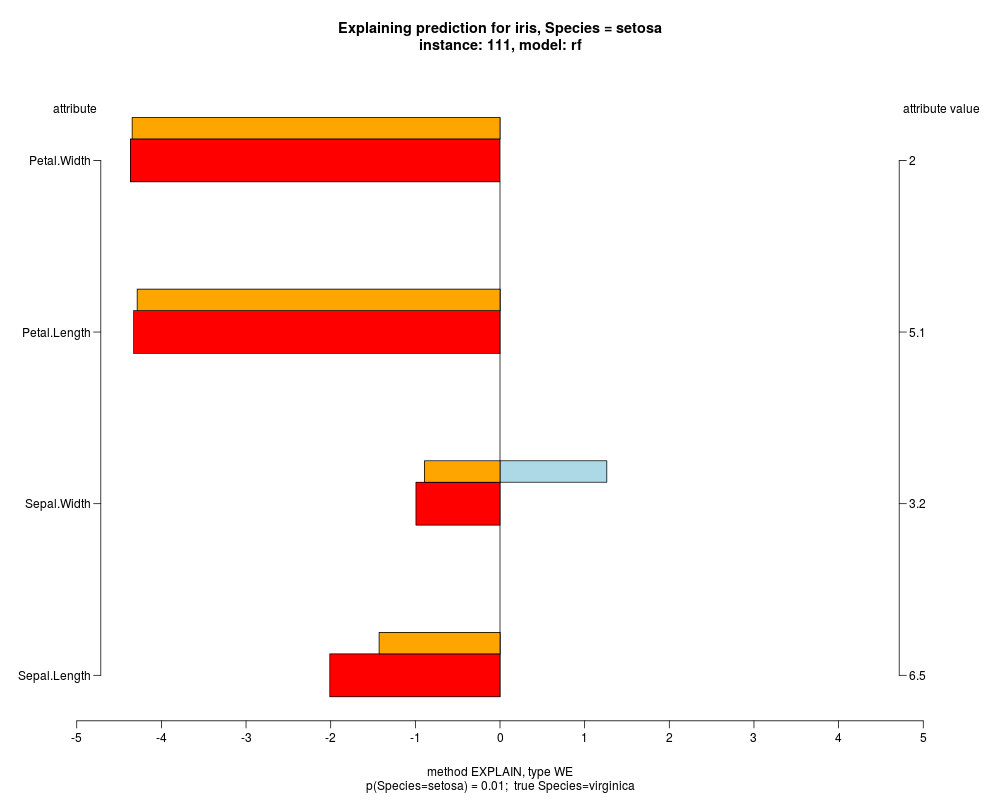
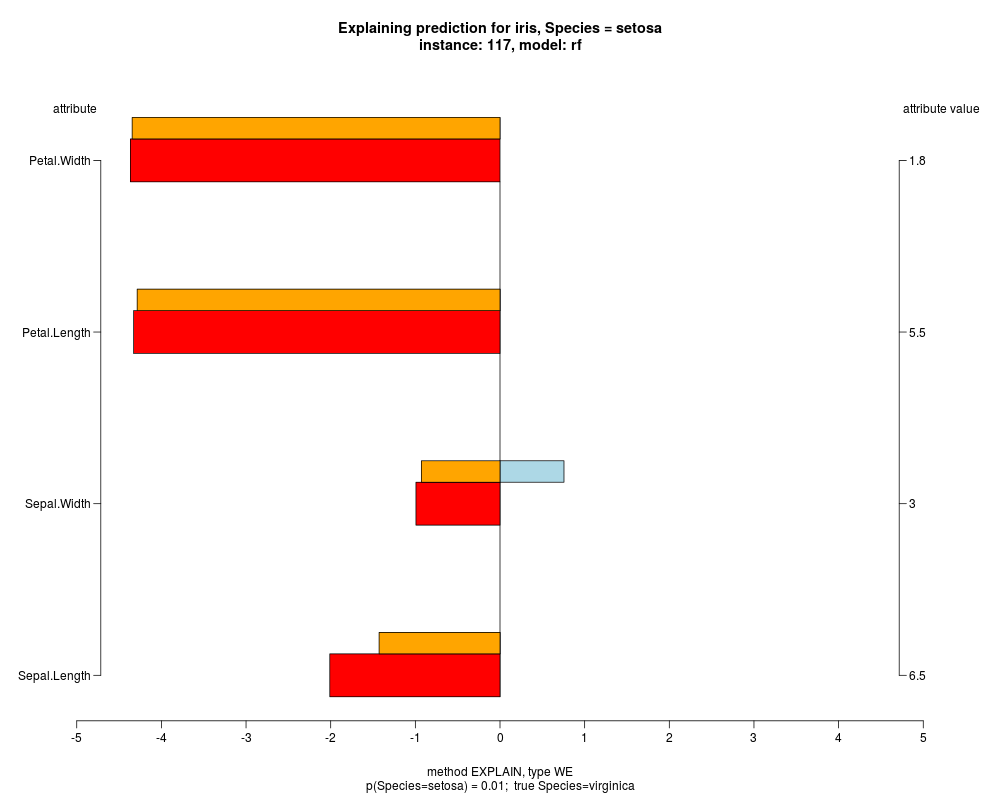
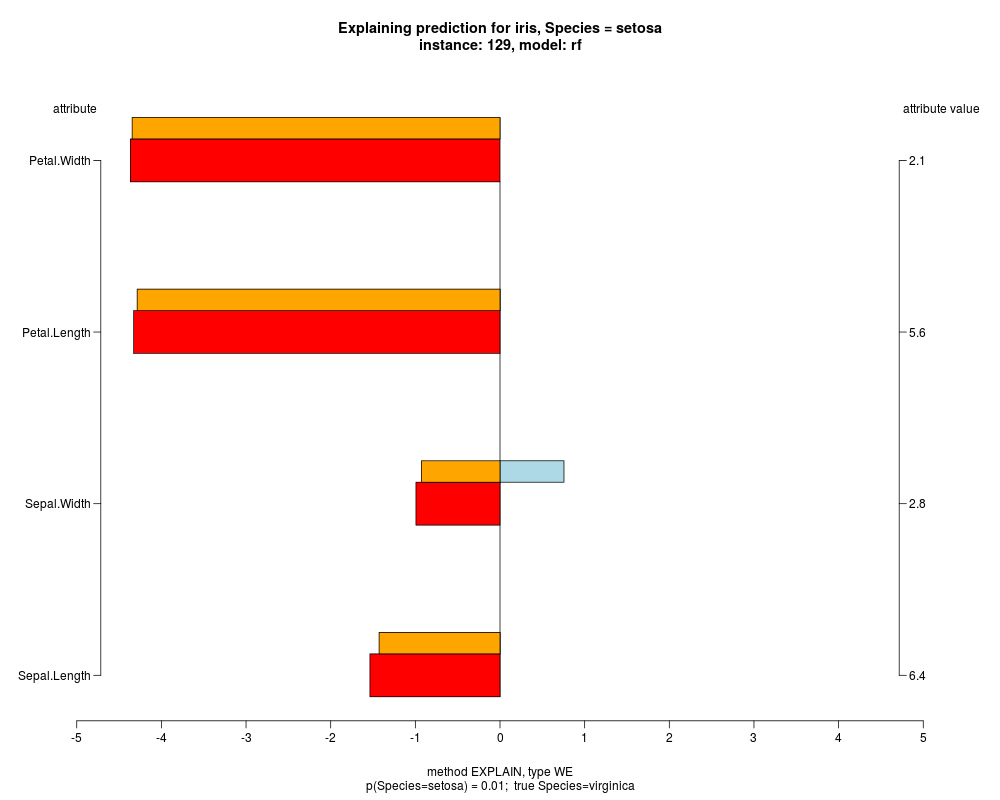
In the instance level visualizations the contributions of each feature are presented (thick bars) as well as average contributions of these
feature values in the trainData (thin bars above them). For details see the references below.
The graph title is composed of problemName, response variable, class value name in case of classification,
type of model, and instance name, extracted from corresponding row.names in testData.
Value
The function explainVis generates explanations and saves their visualizations to a file or
outputs them to graphical device, based on the value of fileType. It invisibly returns a list with three components containing
explanations, average explanations and additional data like discretization used and data generator.
The main ingredients of these three components are:
expl, a matrix of generated explanations (of size dim(testData)),
pCXA, a vector of predictions,
pCXna, (for method EXPLAIN only) a matrix of predictions estimating missing knowledge
of given attribute (of size dim(testData)).
stddev, (for method IME only) a matrix with standard deviations of explanations,
noIter, (for method IME only) a matrix with number of iterations executed for each explanation,
discPoints, (for method EXPLAIN only) a list containing values of discrete features
or centers of discretization intervals for numeric features,
pAV, (for method EXPLAIN only) a list with probabilities for discrete values or
discretization intervals in case of numeric features,
discretization, a list with discretization intervals output by discretize function,
used in estimating averages and model based explanations,
avNames, a list containing the names of discrete values/intervals,
generator, (for IME method only) a generator used to generate random part of instances in IME method,
explAvg, a list with several components giving average explanations on the trainingData.
Averages are given for
attributes, their values (for discrete attributes) and discretization intervals (for numeric features).
These average explanations are used in visualization to give impression how the model works on average. This can be contrasted
with explanation for the specific instance.
Author(s)
Marko Robnik-Sikonja
References
Marko Robnik-Sikonja, Igor Kononenko: Explaining Classifications For Individual Instances.
IEEE Transactions on Knowledge and Data Engineering, 20:589-600, 2008
Erik Strumbelj, Igor Kononenko, Igor, Marko Robnik-Sikonja: Explaining Instance Classifications with Interactions of
Subsets of Feature Values. Data and Knowledge Engineering, 68(10):886-904, Oct. 2009
Erik Strumbelj, Igor Kononenko: An Efficient Explanation of Individual Classifications using Game Theory,
Journal of Machine Learning Research, 11(1):1-18, 2010.
Marko Robnik-Sikonja, Igor Kononenko: Discretization of continuous attributes using ReliefF.
Proceedings of ERK'95, B149-152, Ljubljana, 1995
# use iris data set, split it randomly into a training and testing set
trainIdxs <- sample(x=nrow(iris), size=0.7*nrow(iris), replace=FALSE)
testIdxs <- c(1:nrow(iris))[-trainIdxs]
# build random forests model with certain parameters
modelRF <- CoreModel(Species ~ ., iris[trainIdxs,], model="rf",
              selectionEstimator="MDL",minNodeWeightRF=5,
              rfNoTrees=100, maxThreads=1)

# generate model explanation and visualization
# turn on history in the visualization window to see all graphs
explainVis(modelRF, iris[trainIdxs,], iris[testIdxs,], method="EXPLAIN",visLevel="both",
           problemName="iris", fileType="none",
           naMode="avg", explainType="WE", classValue=1, displayColor="color")
## Not run:
#store instance explanations to file
explainVis(modelRF, iris[trainIdxs,], iris[testIdxs,], method="EXPLAIN", visLevel="instance",
           problemName="iris", fileType="pdf",
           naMode="avg", explainType="WE", classValue=1, displayColor="color")
destroyModels(modelRF) # clean up

# build a regression tree
trainReg <- regDataGen(100)
testReg <- regDataGen(20)
modelRT <- CoreModel(response~., trainReg, model="regTree", modelTypeReg=1)
# generate both model and instance level explanation using defaults
explainVis(modelRT, trainReg, testReg) # don't forget to switch on the history
destroyModels(modelRT) #clean up

## End(Not run)
Results
R version 3.3.1 (2016-06-21) -- "Bug in Your Hair"
Copyright (C) 2016 The R Foundation for Statistical Computing
Platform: x86_64-pc-linux-gnu (64-bit)

R is free software and comes with ABSOLUTELY NO WARRANTY.
You are welcome to redistribute it under certain conditions.
Type 'license()' or 'licence()' for distribution details.

R is a collaborative project with many contributors.
Type 'contributors()' for more information and
'citation()' on how to cite R or R packages in publications.

Type 'demo()' for some demos, 'help()' for on-line help, or
'help.start()' for an HTML browser interface to help.
Type 'q()' to quit R.

> library(ExplainPrediction)
Loading required package: CORElearn
Loading required package: semiArtificial
> png(filename="/home/ddbj/snapshot/RGM3/R_CC/result/ExplainPrediction/explanation.Rd_%03d_medium.png", width=480, height=480)
> ### Name: explanation
> ### Title: Explanation of predictions on instance and model level
> ### Aliases: explain prepareForExplanations explanationAverages explainVis
> ### Keywords: models regression classif
>
> ### ** Examples
>
> # use iris data set, split it randomly into a training and testing set
> trainIdxs <- sample(x=nrow(iris), size=0.7*nrow(iris), replace=FALSE)
> testIdxs <- c(1:nrow(iris))[-trainIdxs]
> # build random forests model with certain parameters
> modelRF <- CoreModel(Species ~ ., iris[trainIdxs,], model="rf",
+               selectionEstimator="MDL",minNodeWeightRF=5,
+               rfNoTrees=100, maxThreads=1)
>
> # generate model explanation and visualization
> # turn on history in the visualization window to see all graphs
> explainVis(modelRF, iris[trainIdxs,], iris[testIdxs,], method="EXPLAIN",visLevel="both",
+            problemName="iris", fileType="none",
+            naMode="avg", explainType="WE", classValue=1, displayColor="color")
> ## Not run:
> ##D #store instance explanations to file
> ##D explainVis(modelRF, iris[trainIdxs,], iris[testIdxs,], method="EXPLAIN", visLevel="instance",
> ##D            problemName="iris", fileType="pdf",
> ##D            naMode="avg", explainType="WE", classValue=1, displayColor="color")
> ##D destroyModels(modelRF) # clean up
> ##D
> ##D # build a regression tree
> ##D trainReg <- regDataGen(100)
> ##D testReg <- regDataGen(20)
> ##D modelRT <- CoreModel(response~., trainReg, model="regTree", modelTypeReg=1)
> ##D # generate both model and instance level explanation using defaults
> ##D explainVis(modelRT, trainReg, testReg) # don't forget to switch on the history
> ##D destroyModels(modelRT) #clean up
> ## End(Not run)
>
>
>
>
>
> dev.off()
null device
          1
>
 .
.