Supported by Dr. Osamu Ogasawara and  . . |
|
Last data update: 2014.03.03 |
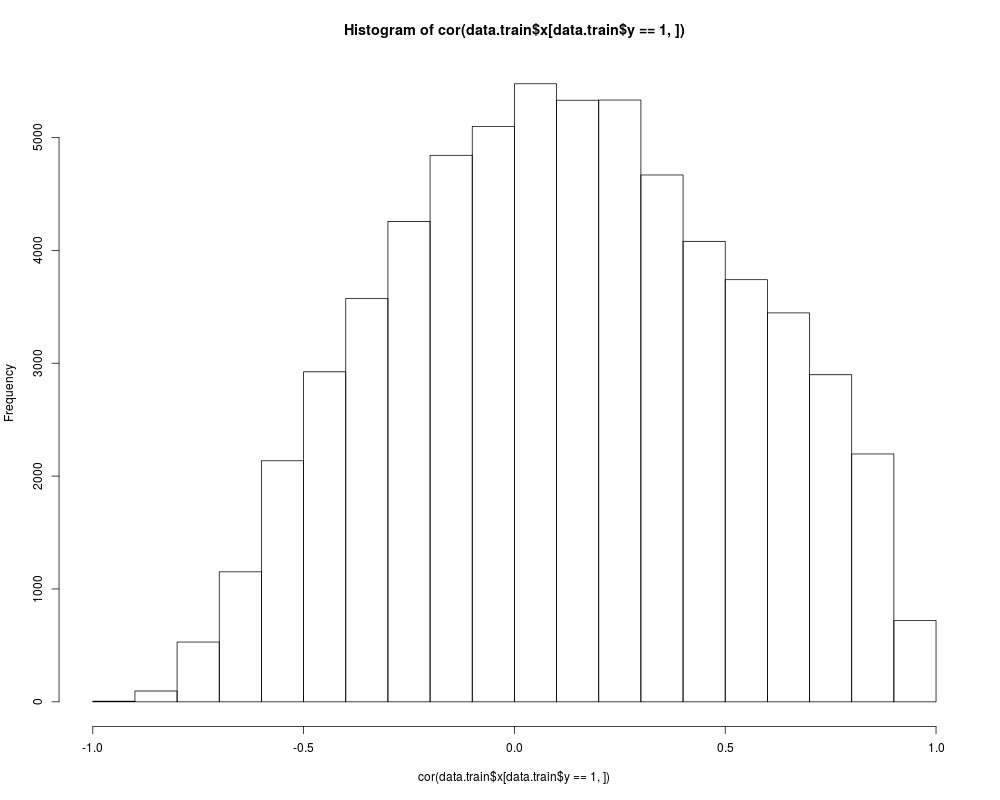
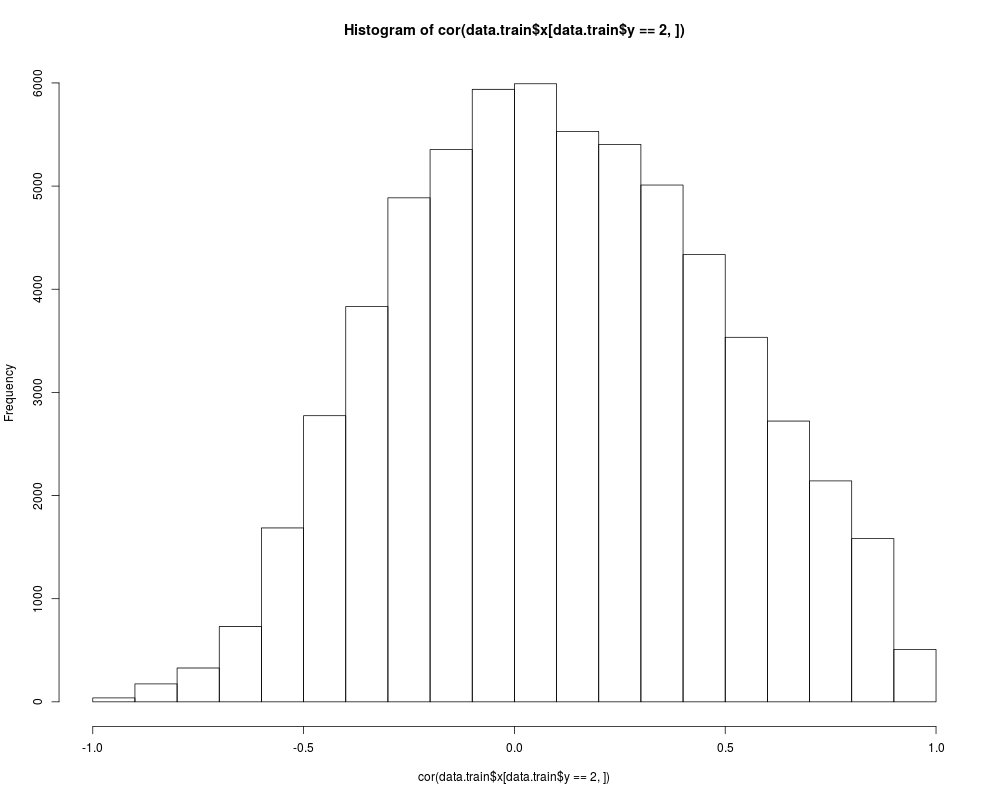
Training dataDescriptionSimulated training dataset. The x component is a matrix of explanatory variables, with 30 rows and 250 columns. Each row is simulated according to a multinormal distribution which mean depends on a group membership given by the y component. The variance matrix is the same within each group. Usagedata(data.train) FormatA list with 2 components. Examplesdata(data.train) dim(data.train$x) # 30 250 data.train$y # 2 levels hist(cor(data.train$x[data.train$y==1,])) # high dependence hist(cor(data.train$x[data.train$y==2,])) Results
R version 3.3.1 (2016-06-21) -- "Bug in Your Hair"
Copyright (C) 2016 The R Foundation for Statistical Computing
Platform: x86_64-pc-linux-gnu (64-bit)

R is free software and comes with ABSOLUTELY NO WARRANTY.
You are welcome to redistribute it under certain conditions.
Type 'license()' or 'licence()' for distribution details.

R is a collaborative project with many contributors.
Type 'contributors()' for more information and
'citation()' on how to cite R or R packages in publications.

Type 'demo()' for some demos, 'help()' for on-line help, or
'help.start()' for an HTML browser interface to help.
Type 'q()' to quit R.

> library(FADA)
Loading required package: MASS
Loading required package: elasticnet
Loading required package: lars
Loaded lars 1.2

> png(filename="/home/ddbj/snapshot/RGM3/R_CC/result/FADA/data.train.Rd_%03d_medium.png", width=480, height=480)
> ### Name: data.train
> ### Title: Training data
> ### Aliases: data.train
>
> ### ** Examples
>
> data(data.train)
> dim(data.train$x) # 30 250
[1]  30 250
> data.train$y # 2 levels
 [1] 1 1 1 1 1 1 1 1 1 1 1 1 1 1 1 2 2 2 2 2 2 2 2 2 2 2 2 2 2 2
> hist(cor(data.train$x[data.train$y==1,])) # high dependence
> hist(cor(data.train$x[data.train$y==2,]))
>
>
>
>
>
> dev.off()
null device
          1
>
|
Created & Maintained by Osamu Ogasawara (osamu.ogasawara@gmail.com) and 