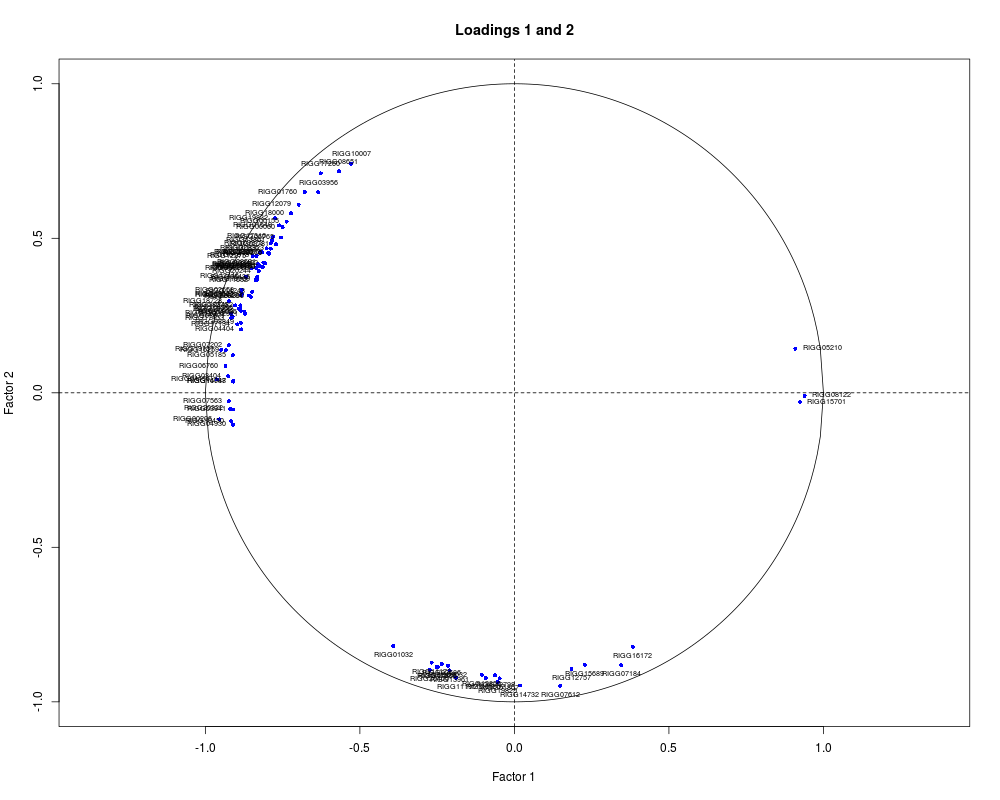
This function helps the user to describe and interpret the factors using some available external information on either genes or arrays. Diagnostic plots are provided.
Boolean (TRUE by default). If TRUE, diagnostic plots are provided (unless the 'FAMTmodel' has less than one factor).
axes
Vector of length 2, specifying the factors to plot.
select.covar
Selection of external covariates. If NULL (default value), the function takes all covariates except the array identifiers and those used in the model.
select.annot
Selection of external annotations. If NULL (default value), the function takes all the available factors in 'annotations'.
lim.b
Proportion of variables with the highest loadings for each factor to appear on plots or in tables (0.01 by default).
lab
Boolean. If TRUE (default value), array names are labeled on the figure
cex
A numerical value giving the amount by which plotting text and symbol should be enlarged relative to the default (1 is the default value)
Value
loadings
highest loadings (B matrix) for each factor. The proportion of loading is determined by "lim.b"
covariates
Matrix of p-values for the tests of linear relationships between scores on each factor (rows) and external covariates (columns).
annotations
Matrix of p-values for the tests of linear relationships between loadings of each factor (rows) and external annotations (columns).
Author(s)
David Causeur, Maela Kloareg
See Also
as.FAMTdata, modelFAMT
Examples
## FAMT data
data(expression)
data(covariates)
data(annotations)

# Create the 'FAMTdata'
############################################
chicken = as.FAMTdata(expression,covariates,annotations,idcovar=2)
# 'FAMTdata' summary
## Not run: summaryFAMT(chicken)

# FAMT complete multiple testing procedure
############################################
model = modelFAMT(chicken,x=c(3,6),test=6,nbf=3)
# summary on the 'FAMT model'
## Not run: summaryFAMT(model)

# Factors description
############################################
chicken.defacto = defacto(model,axes=1:2,select.covar=4:5,select.annot=3:6,
cex=0.6)
Results
R version 3.3.1 (2016-06-21) -- "Bug in Your Hair"
Copyright (C) 2016 The R Foundation for Statistical Computing
Platform: x86_64-pc-linux-gnu (64-bit)

R is free software and comes with ABSOLUTELY NO WARRANTY.
You are welcome to redistribute it under certain conditions.
Type 'license()' or 'licence()' for distribution details.

R is a collaborative project with many contributors.
Type 'contributors()' for more information and
'citation()' on how to cite R or R packages in publications.

Type 'demo()' for some demos, 'help()' for on-line help, or
'help.start()' for an HTML browser interface to help.
Type 'q()' to quit R.

> library(FAMT)
Loading required package: mnormt
Loading required package: impute
> png(filename="/home/ddbj/snapshot/RGM3/R_CC/result/FAMT/defacto.Rd_%03d_medium.png", width=480, height=480)
> ### Name: defacto
> ### Title: FAMT factors description
> ### Aliases: defacto
>
> ### ** Examples
>
> ## FAMT data
> data(expression)
> data(covariates)
> data(annotations)
>
> # Create the 'FAMTdata'
> ############################################
> chicken = as.FAMTdata(expression,covariates,annotations,idcovar=2)
$`Rows with missing values`
integer(0)

$`Columns with missing values`
integer(0)

> # 'FAMTdata' summary
> ## Not run: summaryFAMT(chicken)
>
> # FAMT complete multiple testing procedure
> ############################################
> model = modelFAMT(chicken,x=c(3,6),test=6,nbf=3)
[1] "Fitting Factor Analysis Model with 3 factors"
[1] "Fitting Factor Analysis Model with 3 factors"
> # summary on the 'FAMT model'
> ## Not run: summaryFAMT(model)
>
> # Factors description
> ############################################
> chicken.defacto = defacto(model,axes=1:2,select.covar=4:5,select.annot=3:6,
+ cex=0.6)
dev.new(): using pdf(file="Rplots822.pdf")
>
>
>
>
>
> dev.off()
png
  2
>
 .
.