Supported by Dr. Osamu Ogasawara and  . . |
|
Last data update: 2014.03.03 |
Simulates FDDescriptionA fractional Gaussian noise time series is simulated. UsageSimulateFD(n, d) Arguments
DetailsThe FFT is used so it is most efficient if you select n to be a power of 2. Note, d=H-1/2. Valuevector of length containing the simulated time series Author(s)A.I. McLeod ReferencesDavies, R. B. and Harte, D. S. (1987). Tests for Hurst Effect. Biometrika 74, 95–101. McLeod, A.I., Yu, Hao, Krougly, Zinovi L. (2007). Algorithms for Linear Time Series Analysis, Journal of Statistical Software. See Also
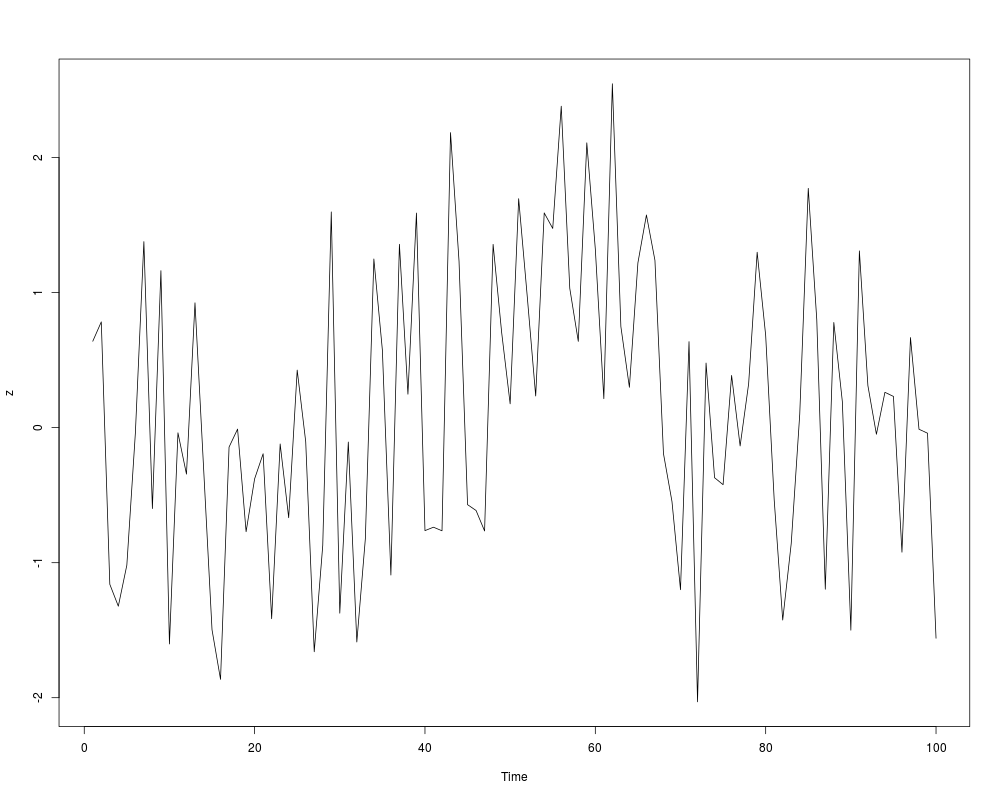
Examples#Example 1 #simulate a process with H=0.2 and plot it z<-SimulateFD(100, 0.2) ts.plot(z) Results
R version 3.3.1 (2016-06-21) -- "Bug in Your Hair"
Copyright (C) 2016 The R Foundation for Statistical Computing
Platform: x86_64-pc-linux-gnu (64-bit)

R is free software and comes with ABSOLUTELY NO WARRANTY.
You are welcome to redistribute it under certain conditions.
Type 'license()' or 'licence()' for distribution details.

R is a collaborative project with many contributors.
Type 'contributors()' for more information and
'citation()' on how to cite R or R packages in publications.

Type 'demo()' for some demos, 'help()' for on-line help, or
'help.start()' for an HTML browser interface to help.
Type 'q()' to quit R.

> library(FGN)
> png(filename="/home/ddbj/snapshot/RGM3/R_CC/result/FGN/SimulateFD.Rd_%03d_medium.png", width=480, height=480)
> ### Name: SimulateFD
> ### Title: Simulates FD
> ### Aliases: SimulateFD
> ### Keywords: ts datagen
>
> ### ** Examples
>
> #Example 1
> #simulate a process with H=0.2 and plot it
> z<-SimulateFD(100, 0.2)
> ts.plot(z)
>
>
>
>
>
> dev.off()
null device
          1
>
|
Created & Maintained by Osamu Ogasawara (osamu.ogasawara@gmail.com) and 