Supported by Dr. Osamu Ogasawara and  . . |
|
Last data update: 2014.03.03 |
Plots to visualize age-length keys.DescriptionVarious plots to visualize the proportion of fish of certain ages within length intervals in an age-length key. Usage
alkPlot(key, type = c("barplot", "area", "lines", "splines", "bubble"),
  xlab = "Length", ylab = ifelse(type != "bubble", "Proportion", "Age"),
  xlim = NULL, ylim = NULL, showLegend = FALSE, lbl.cex = 1.25,
  leg.cex = 1, lwd = 2, span = 0.25, pal = paletteChoices(),
  grid = TRUE, col = "gray80", buf = 0.45, add = FALSE, ...)
Arguments
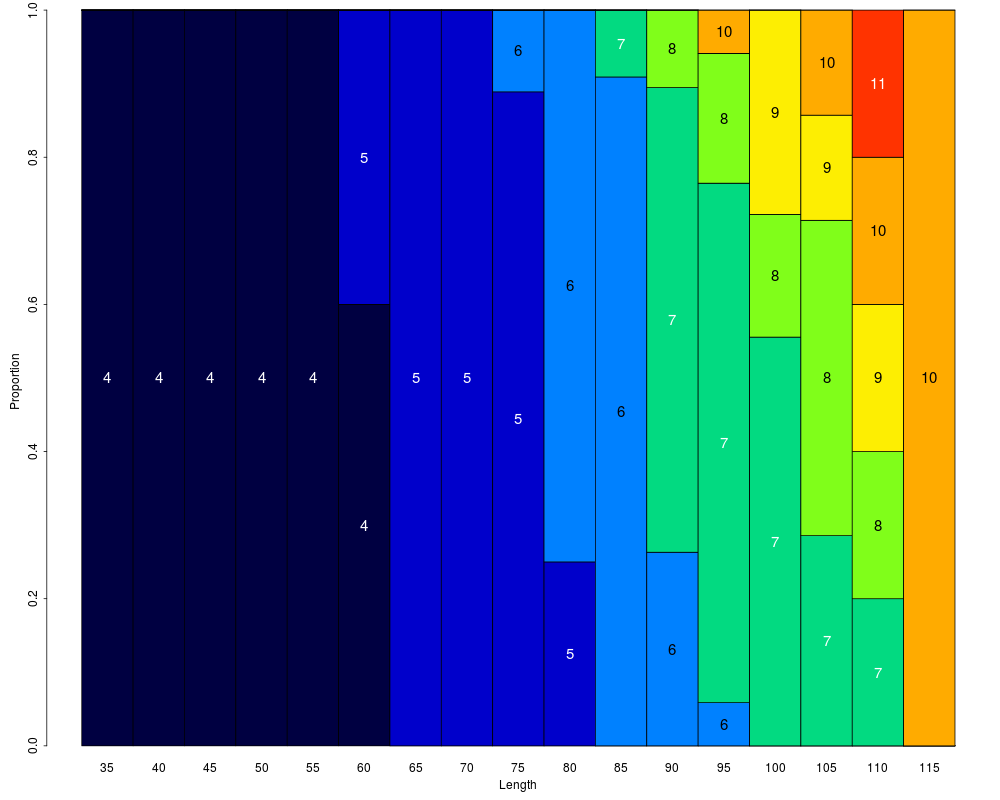
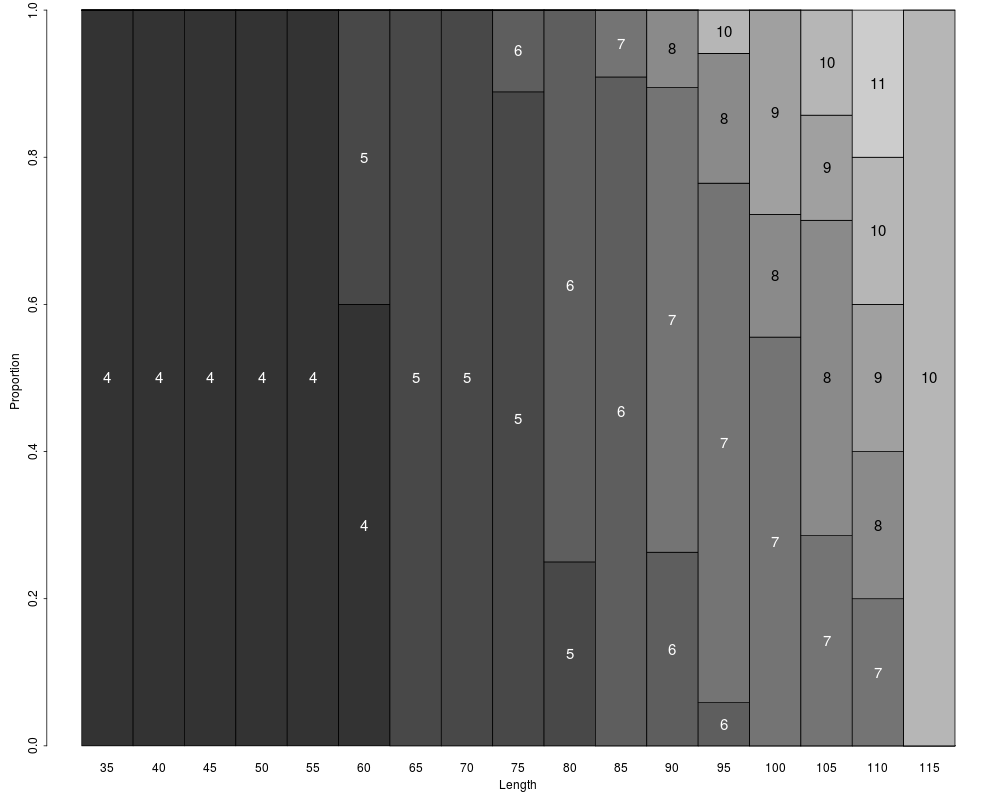
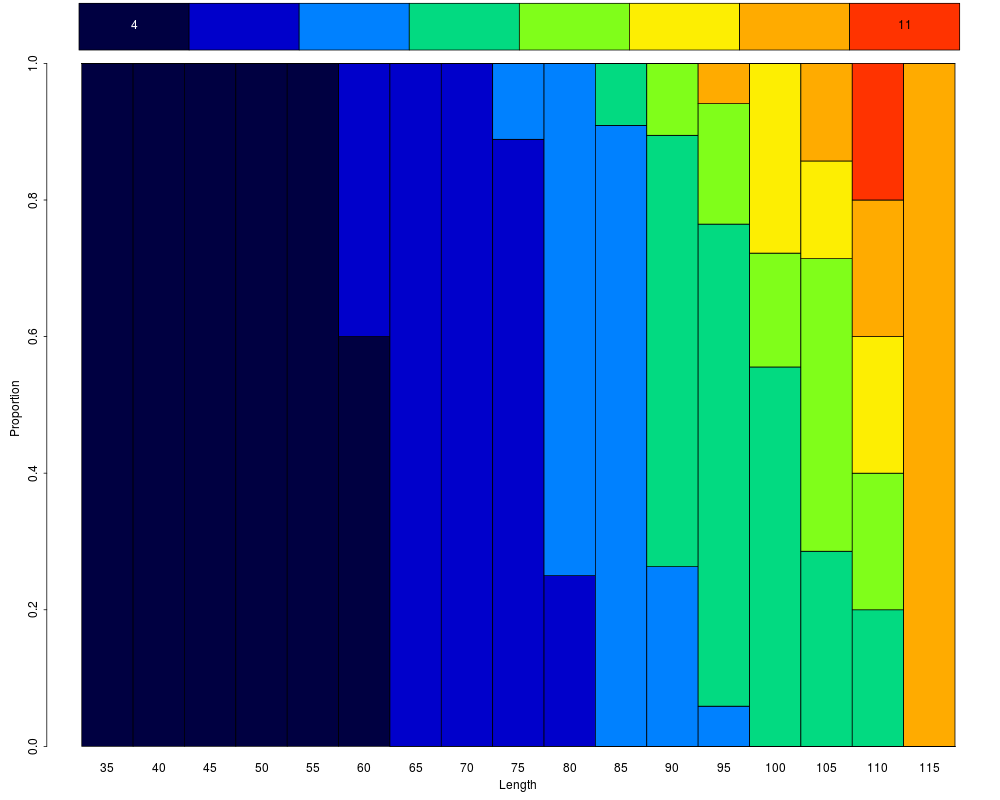
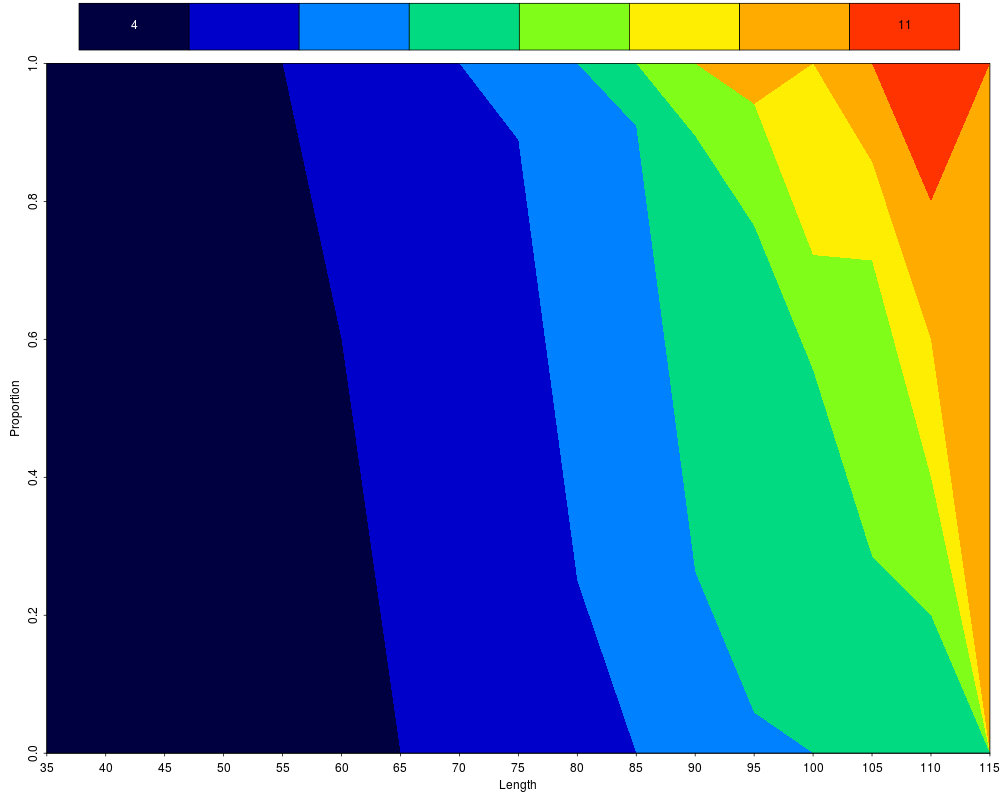
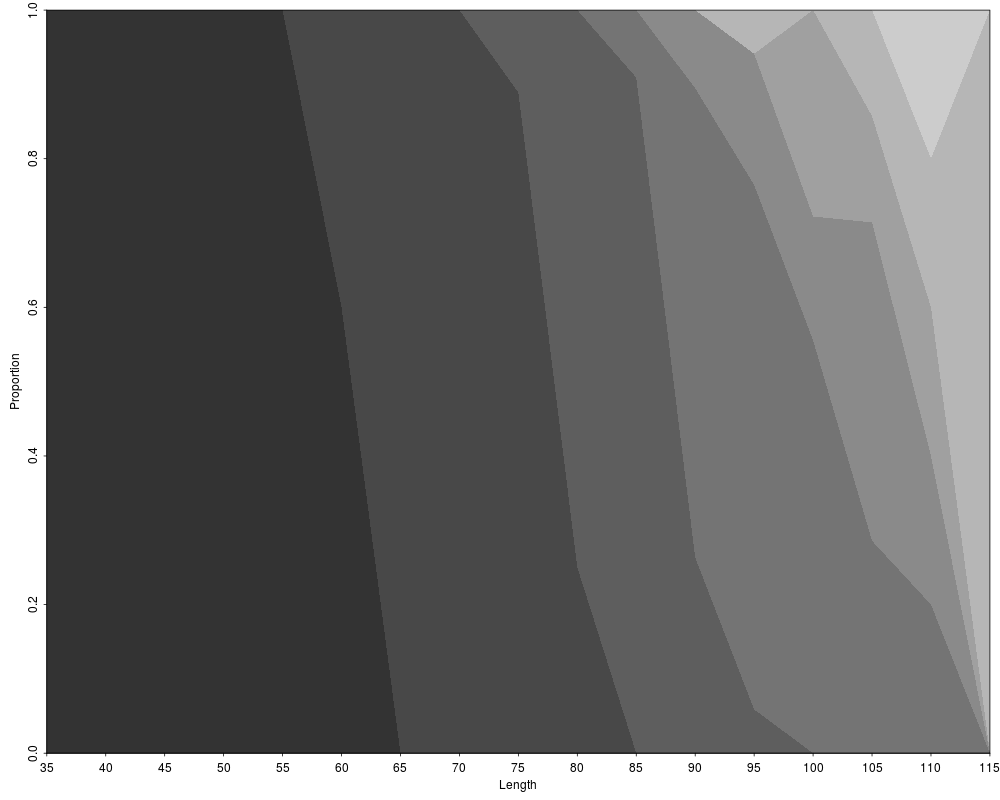
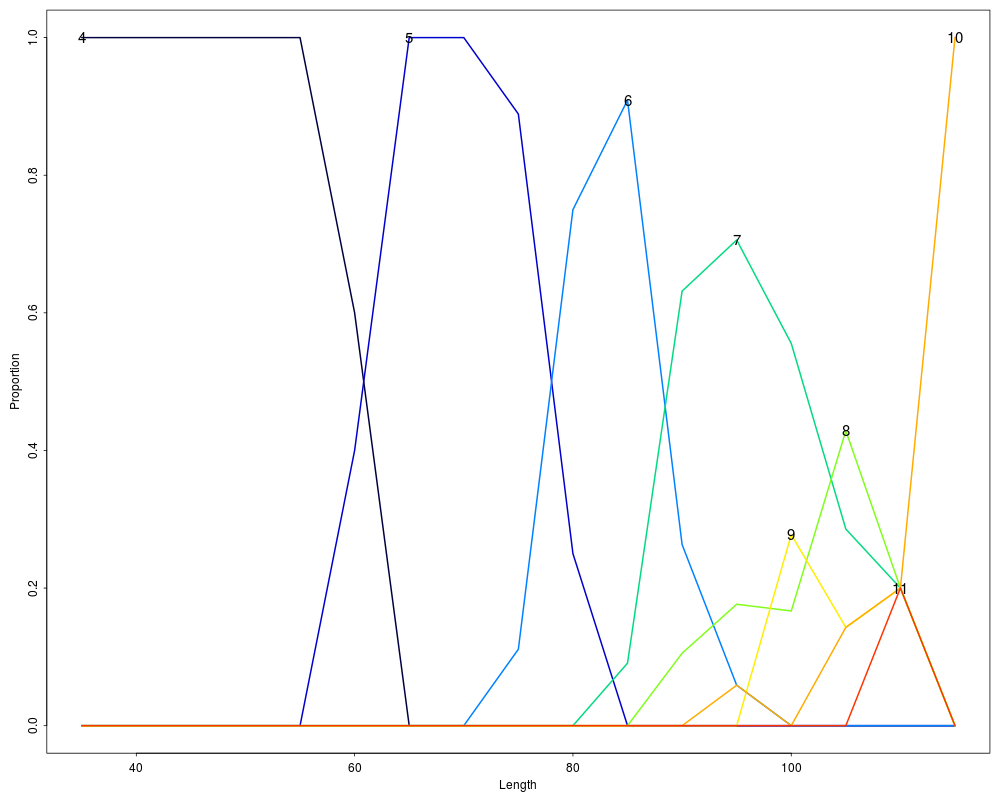
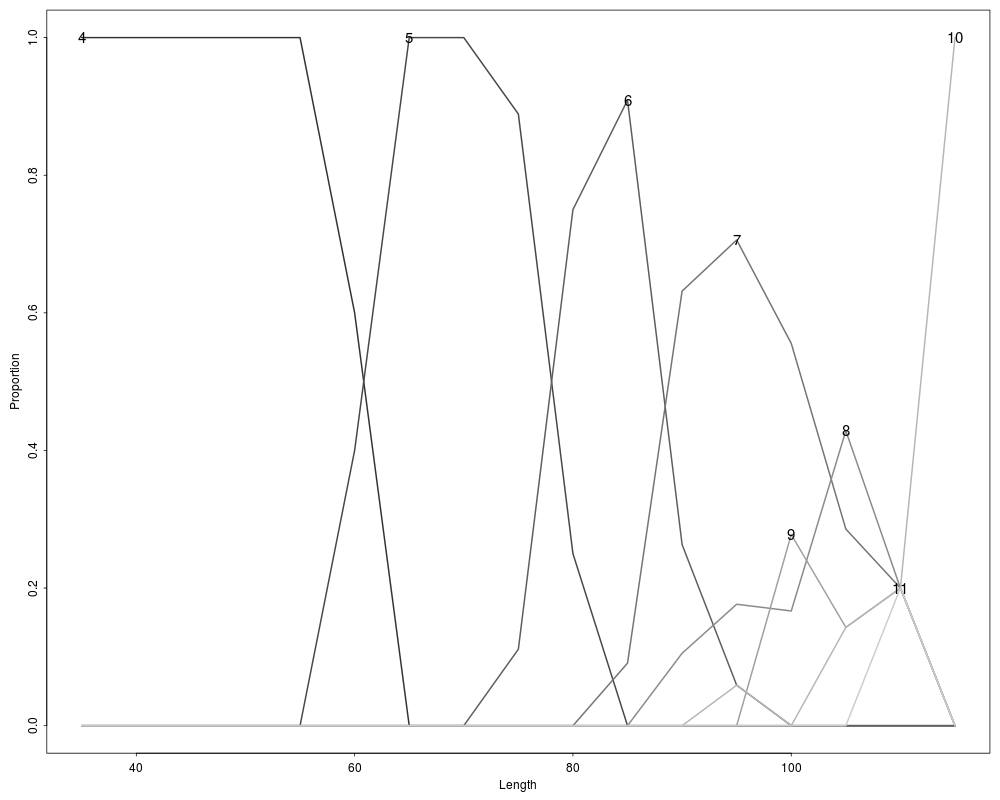
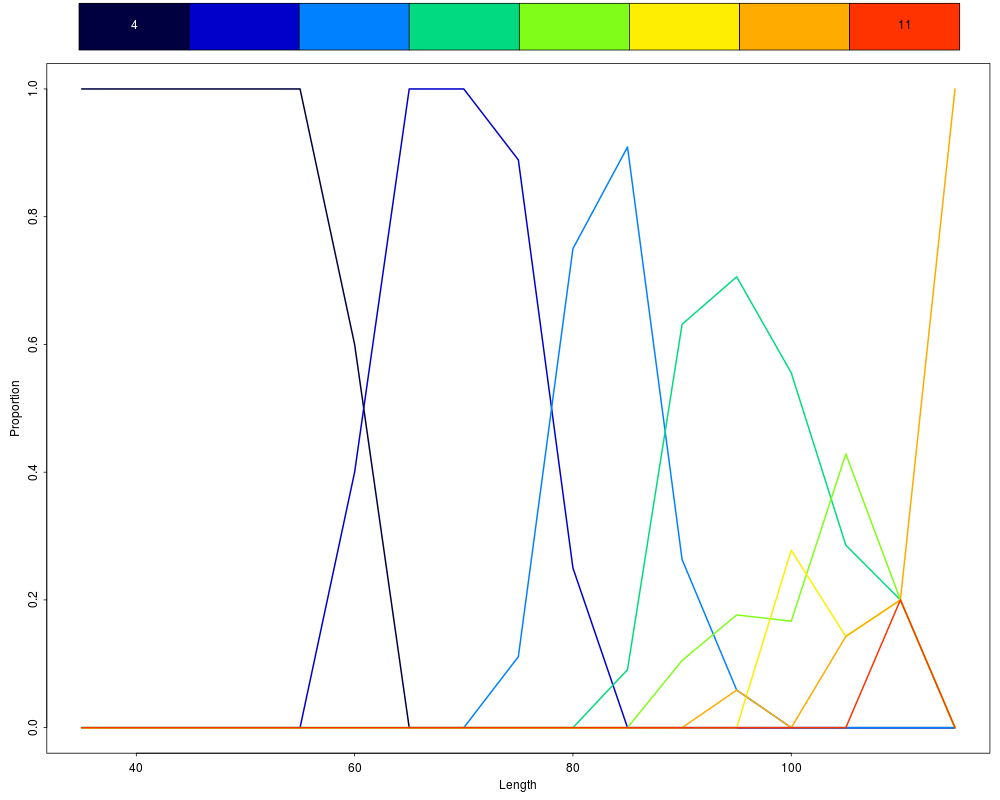
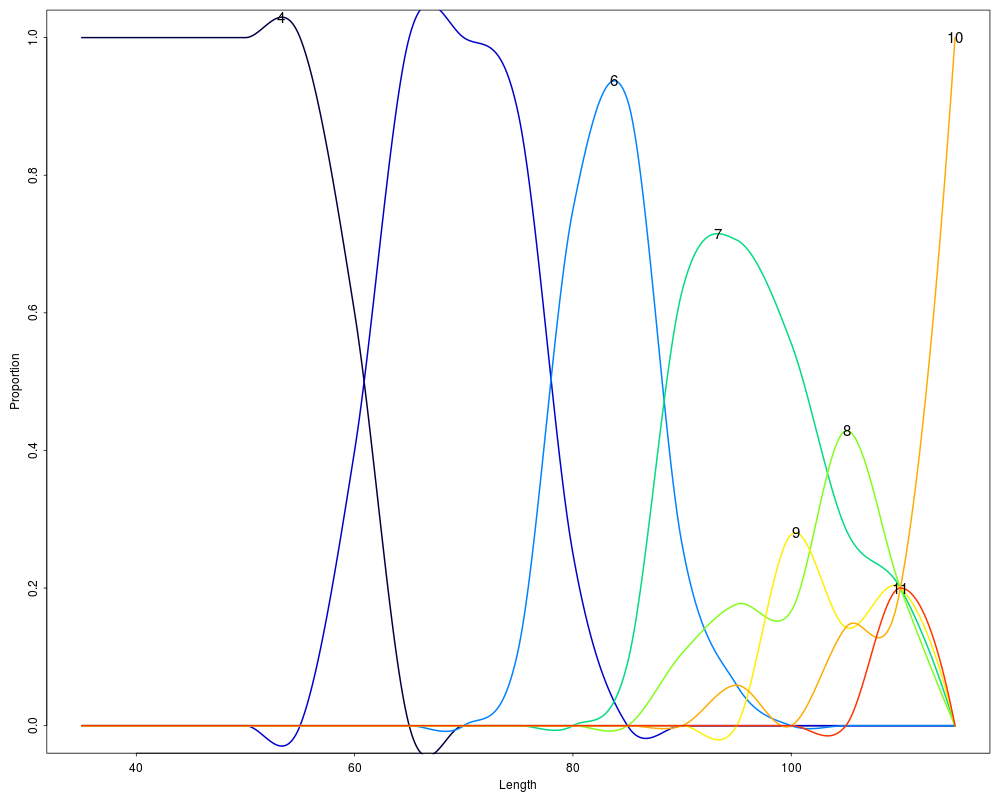
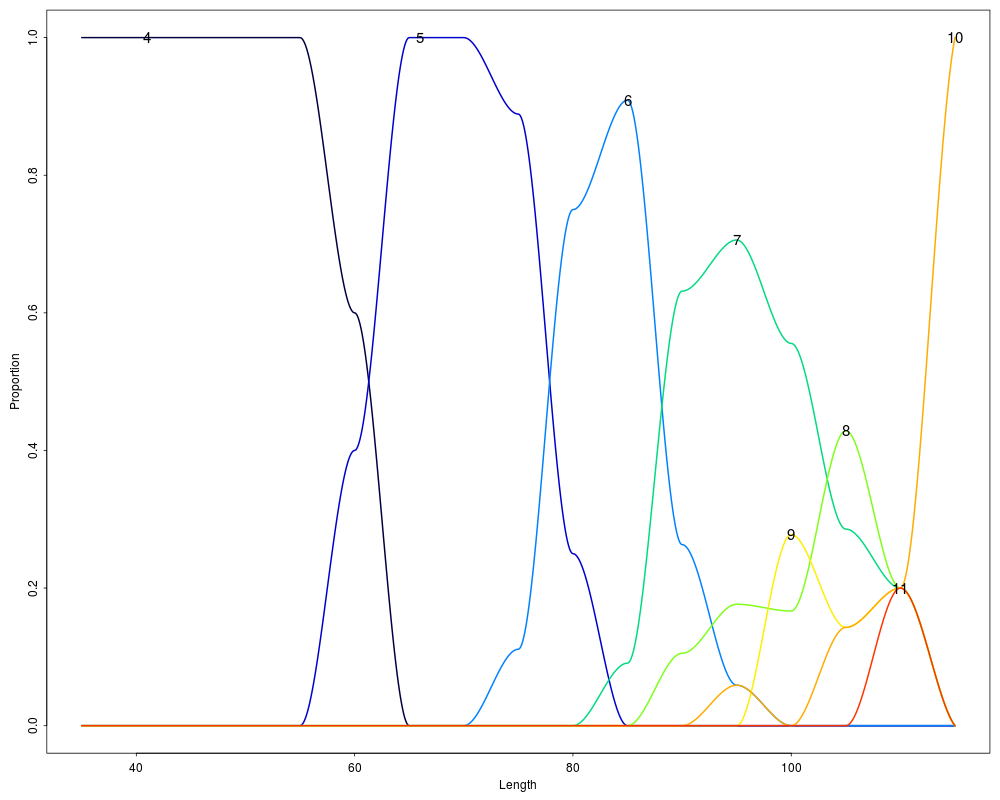
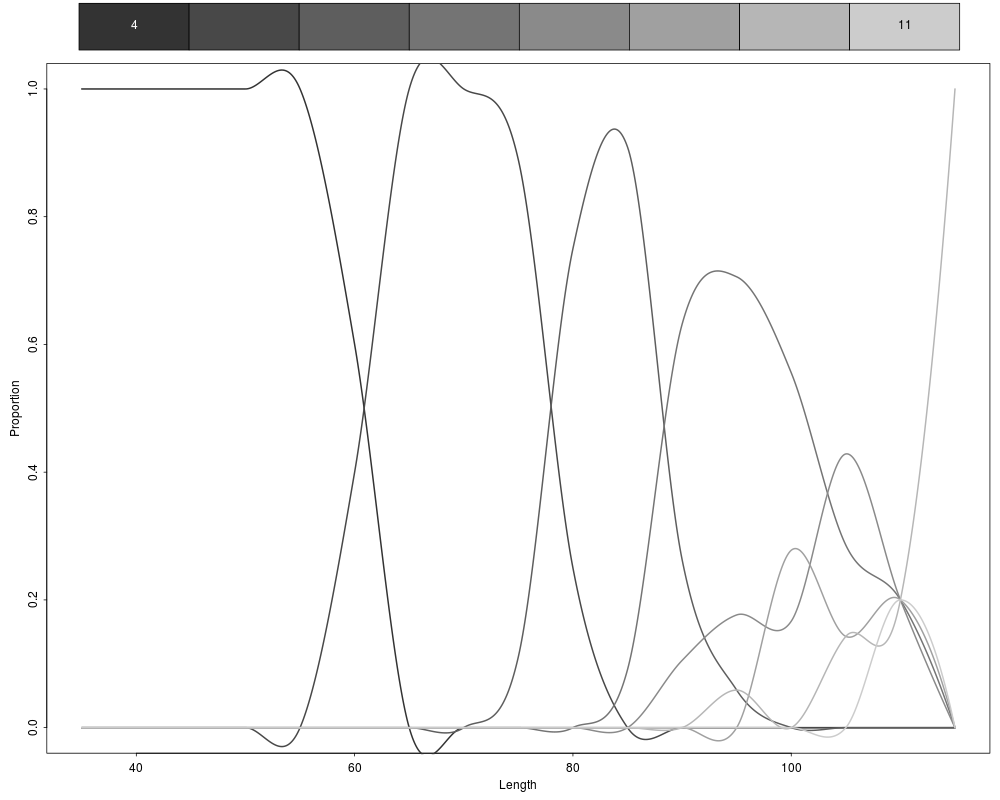
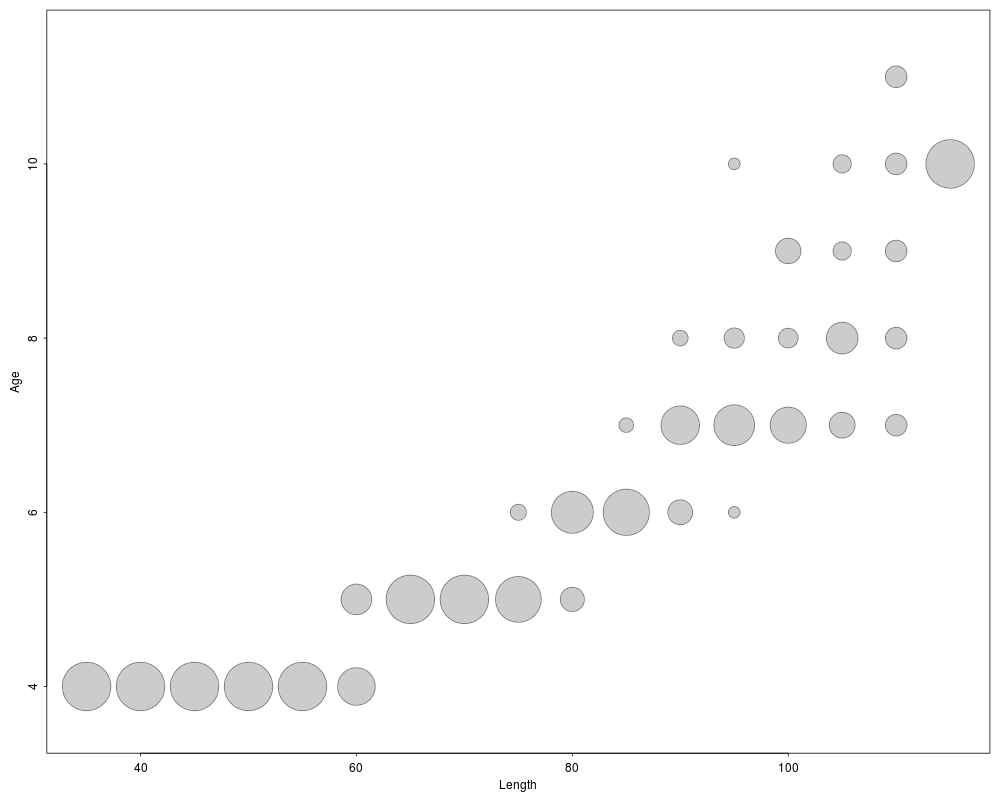
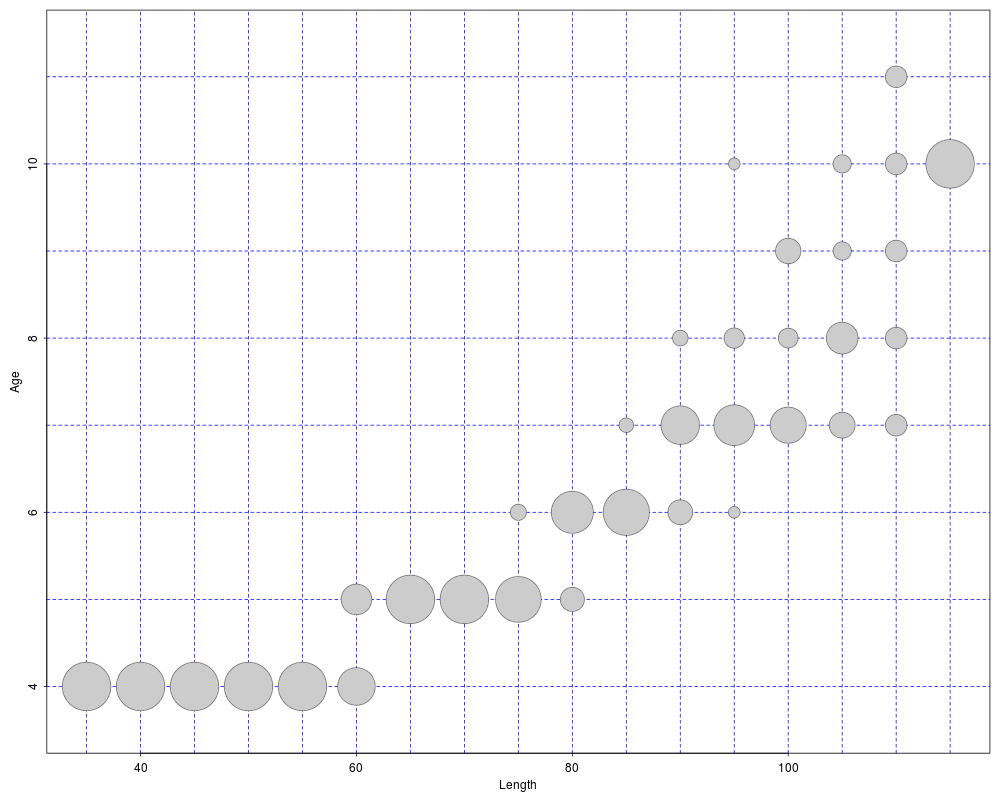
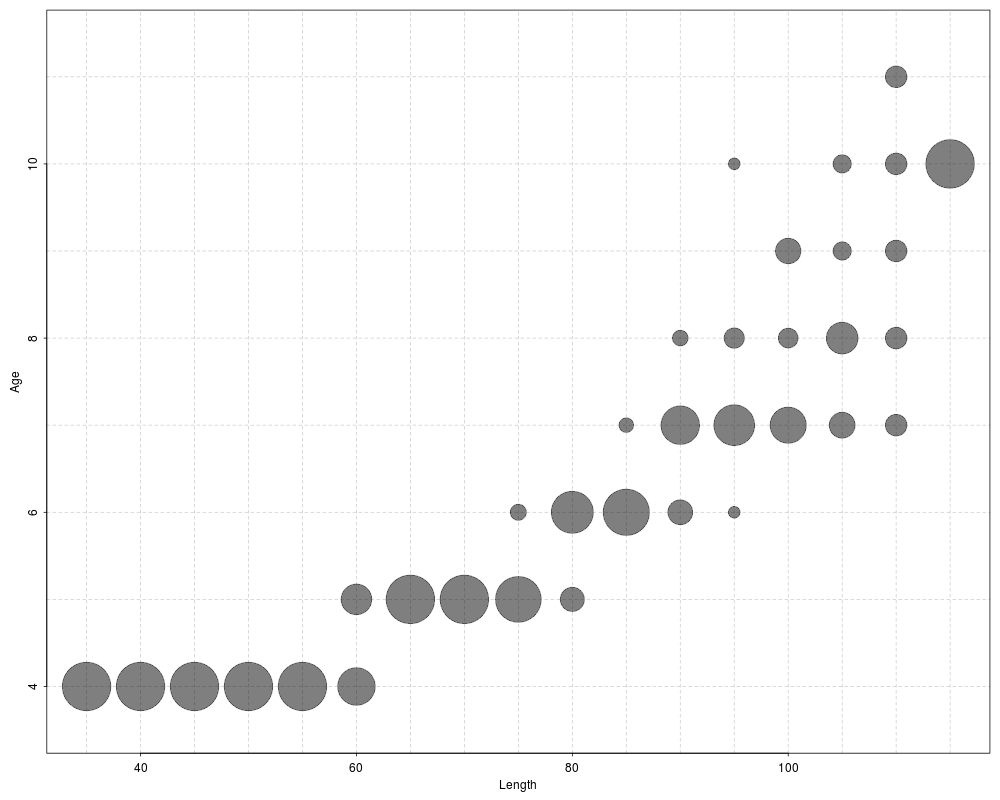
DetailsA variety of plots can be used to visualize the proportion of fish of certain ages within length intervals of an age-length key. The types of plots are described below and illustrated in the examples.
Note that all plots are “vertically conditional” – i.e., each represents the proportional ages WITHIN each length interval. ValueNone, but a plot is constructed. IFAR Chapter5-Age-Length Key. Author(s)Derek H. Ogle, derek@derekogle.com ReferencesOgle, D.H. 2016. Introductory Fisheries Analyses with R. Chapman & Hall/CRC, Boca Raton, FL. See AlsoSee Examples## Make an example age-length key data(WR79) WR.age <- subset(WR79, !is.na(age)) # isolate the age sample WR.age$LCat <- lencat(WR.age$len,w=5) # add length intervals (width=5) raw <- xtabs(~LCat+age,data=WR.age) # create age-length key ( WR.key <- prop.table(raw, margin=1) ) ## Various visualizations of the age-length key alkPlot(WR.key,"barplot") alkPlot(WR.key,"barplot",pal="gray") alkPlot(WR.key,"barplot",showLegend=TRUE) alkPlot(WR.key,"area") alkPlot(WR.key,"area",showLegend=TRUE) alkPlot(WR.key,"area",pal="gray") alkPlot(WR.key,"lines") alkPlot(WR.key,"lines",pal="gray") alkPlot(WR.key,"lines",showLegend=TRUE) alkPlot(WR.key,"splines") alkPlot(WR.key,"splines",span=0.2) alkPlot(WR.key,"splines",pal="gray",showLegend=TRUE) alkPlot(WR.key,"bubble") alkPlot(WR.key,"bubble",grid=FALSE) alkPlot(WR.key,"bubble",grid="blue") alkPlot(WR.key,"bubble",grid=rgb(0,0,0,0.2),col=rgb(0,0,0,0.5)) Results
R version 3.3.1 (2016-06-21) -- "Bug in Your Hair"
Copyright (C) 2016 The R Foundation for Statistical Computing
Platform: x86_64-pc-linux-gnu (64-bit)

R is free software and comes with ABSOLUTELY NO WARRANTY.
You are welcome to redistribute it under certain conditions.
Type 'license()' or 'licence()' for distribution details.

R is a collaborative project with many contributors.
Type 'contributors()' for more information and
'citation()' on how to cite R or R packages in publications.

Type 'demo()' for some demos, 'help()' for on-line help, or
'help.start()' for an HTML browser interface to help.
Type 'q()' to quit R.

> library(FSA)


 ############################################
 ##      FSA package, version 0.8.7        ##
 ##    Derek H. Ogle, Northland College    ##
 ##                                        ##
 ## Run ?FSA for documentation.            ##
 ## Run citation('FSA') for citation ...   ##
 ##   please cite if used in publication.  ##
 ##                                        ##
 ## See derekogle.com/fishR/ for more      ##
 ##   thorough analytical vignettes.       ##
 ############################################


> png(filename="/home/ddbj/snapshot/RGM3/R_CC/result/FSA/alkPlot.Rd_%03d_medium.png", width=480, height=480)
> ### Name: alkPlot
> ### Title: Plots to visualize age-length keys.
> ### Aliases: alkPlot
> ### Keywords: plot
>
> ### ** Examples
>
> ## Make an example age-length key
> data(WR79)
> WR.age <- subset(WR79, !is.na(age))      # isolate the age sample
> WR.age$LCat <- lencat(WR.age$len,w=5)    # add length intervals (width=5)
> raw <- xtabs(~LCat+age,data=WR.age)      # create age-length key
> ( WR.key <- prop.table(raw, margin=1) )
     age
LCat           4          5          6          7          8          9
  35  1.00000000 0.00000000 0.00000000 0.00000000 0.00000000 0.00000000
  40  1.00000000 0.00000000 0.00000000 0.00000000 0.00000000 0.00000000
  45  1.00000000 0.00000000 0.00000000 0.00000000 0.00000000 0.00000000
  50  1.00000000 0.00000000 0.00000000 0.00000000 0.00000000 0.00000000
  55  1.00000000 0.00000000 0.00000000 0.00000000 0.00000000 0.00000000
  60  0.60000000 0.40000000 0.00000000 0.00000000 0.00000000 0.00000000
  65  0.00000000 1.00000000 0.00000000 0.00000000 0.00000000 0.00000000
  70  0.00000000 1.00000000 0.00000000 0.00000000 0.00000000 0.00000000
  75  0.00000000 0.88888889 0.11111111 0.00000000 0.00000000 0.00000000
  80  0.00000000 0.25000000 0.75000000 0.00000000 0.00000000 0.00000000
  85  0.00000000 0.00000000 0.90909091 0.09090909 0.00000000 0.00000000
  90  0.00000000 0.00000000 0.26315789 0.63157895 0.10526316 0.00000000
  95  0.00000000 0.00000000 0.05882353 0.70588235 0.17647059 0.00000000
  100 0.00000000 0.00000000 0.00000000 0.55555556 0.16666667 0.27777778
  105 0.00000000 0.00000000 0.00000000 0.28571429 0.42857143 0.14285714
  110 0.00000000 0.00000000 0.00000000 0.20000000 0.20000000 0.20000000
  115 0.00000000 0.00000000 0.00000000 0.00000000 0.00000000 0.00000000
     age
LCat          10         11
  35  0.00000000 0.00000000
  40  0.00000000 0.00000000
  45  0.00000000 0.00000000
  50  0.00000000 0.00000000
  55  0.00000000 0.00000000
  60  0.00000000 0.00000000
  65  0.00000000 0.00000000
  70  0.00000000 0.00000000
  75  0.00000000 0.00000000
  80  0.00000000 0.00000000
  85  0.00000000 0.00000000
  90  0.00000000 0.00000000
  95  0.05882353 0.00000000
  100 0.00000000 0.00000000
  105 0.14285714 0.00000000
  110 0.20000000 0.20000000
  115 1.00000000 0.00000000
>
> ## Various visualizations of the age-length key
> alkPlot(WR.key,"barplot")
> alkPlot(WR.key,"barplot",pal="gray")
> alkPlot(WR.key,"barplot",showLegend=TRUE)
> alkPlot(WR.key,"area")
> alkPlot(WR.key,"area",showLegend=TRUE)
> alkPlot(WR.key,"area",pal="gray")
> alkPlot(WR.key,"lines")
> alkPlot(WR.key,"lines",pal="gray")
> alkPlot(WR.key,"lines",showLegend=TRUE)
> alkPlot(WR.key,"splines")
> alkPlot(WR.key,"splines",span=0.2)
> alkPlot(WR.key,"splines",pal="gray",showLegend=TRUE)
> alkPlot(WR.key,"bubble")
> alkPlot(WR.key,"bubble",grid=FALSE)
> alkPlot(WR.key,"bubble",grid="blue")
> alkPlot(WR.key,"bubble",grid=rgb(0,0,0,0.2),col=rgb(0,0,0,0.5))
>
>
>
>
>
>
> dev.off()
null device
          1
>
|