Supported by Dr. Osamu Ogasawara and  . . |
|
Last data update: 2014.03.03 |
Computes Chapman-Robson estimates of S and Z.DescriptionComputes the Chapman-Robson estimates of annual survival rate (S) and instantaneous mortality rate (Z) from catch-at-age data on the descending limb of a catch-curve. Method functions extract estimates with associated standard errors and confidence intervals. A plot method highlights the descending-limb, shows the linear model on the descending limb, and, optionally, prints the estimated Z and A. Usage
chapmanRobson(x, ...)

## Default S3 method:
chapmanRobson(x, catch, ages2use = age,
  zmethod = c("Smithetal", "Hoenigetal", "original"), ...)

## S3 method for class 'formula'
chapmanRobson(x, data, ages2use = age,
  zmethod = c("Smithetal", "Hoenigetal", "original"), ...)

## S3 method for class 'chapmanRobson'
summary(object, verbose = FALSE, ...)

## S3 method for class 'chapmanRobson'
confint(object, parm = c("all", "both", "S", "Z"),
  level = conf.level, conf.level = 0.95, ...)

## S3 method for class 'chapmanRobson'
plot(x, pos.est = "topright", cex.est = 0.95,
  ylab = "Catch", xlab = "Age", col.pt = "gray30", ...)
Arguments
DetailsThe default is to use all ages in the age vector. This is only appropriate if the age and catch vectors contain only the ages and catches on the descending limb of the catch curve. Use The Chapman-Robson method provides an estimate of the annual survival rate, with the annual mortality rate (A) determined by 1-S. The instantaneous mortality rate is often computed as -log(S). However, Hoenig et al. (1983) showed that this produced a biased (over)estimate of Z and provided a correction. The correction is applied by setting ValueA list with the following items:
TestingTested the results of chapmanRobson against the results in Miranda and Bettoli (2007). The point estimates of S matched perfectly but the SE of S did not because Miranda and Bettoli used a rounded estimate of S in the calculation of the SE of S but chapmanRobson does not. Tested the results against the results from IFAR Chapter11-Mortality. Author(s)Derek H. Ogle, derek@derekogle.com ReferencesOgle, D.H. 2016. Introductory Fisheries Analyses with R. Chapman & Hall/CRC, Boca Raton, FL. Chapman, D.G. and D.S. Robson. 1960. The analysis of a catch curve. Biometrics. 16:354-368. Hoenig, J.M. and W.D. Lawing, and N.A. Hoenig. 1983. Using mean age, mean length and median length data to estimate the total mortality rate. International Council for the Exploration of the Sea, CM 1983/D:23, Copenhagen. Ricker, W.E. 1975. Computation and interpretation of biological statistics of fish populations. Technical Report Bulletin 191, Bulletin of the Fisheries Research Board of Canada. [Was (is?) from http://www.dfo-mpo.gc.ca/Library/1485.pdf.] Robson, D.S. and D.G. Chapman. 1961. Catch curves and mortality rates. Transactions of the American Fisheries Society. 90:181-189. Smith, M.W., A.Y. Then, C. Wor, G. Ralph, K.H. Pollock, and J.M. Hoenig. 2012. Recommendations for catch-curve analysis. North American Journal of Fisheries Management. 32:956-967. See AlsoSee Examplesdata(BrookTroutTH) plot(catch~age,data=BrookTroutTH,pch=19) ## demonstration of formula notation cr1 <- chapmanRobson(catch~age,data=BrookTroutTH,ages2use=2:6) summary(cr1) summary(cr1,verbose=TRUE) confint(cr1) plot(cr1) ## demonstration of excluding ages2use cr2 <- chapmanRobson(catch~age,data=BrookTroutTH,ages2use=-c(0,1)) summary(cr2) plot(cr2) ## demonstration of ability to work with missing age classes age <- c( 2, 3, 4, 5, 7, 9,12) ct <- c(100,92,83,71,56,35, 1) cr3 <- chapmanRobson(age,ct,4:12) summary(cr3) plot(cr3) Results
R version 3.3.1 (2016-06-21) -- "Bug in Your Hair"
Copyright (C) 2016 The R Foundation for Statistical Computing
Platform: x86_64-pc-linux-gnu (64-bit)
R is free software and comes with ABSOLUTELY NO WARRANTY.
You are welcome to redistribute it under certain conditions.
Type 'license()' or 'licence()' for distribution details.
R is a collaborative project with many contributors.
Type 'contributors()' for more information and
'citation()' on how to cite R or R packages in publications.
Type 'demo()' for some demos, 'help()' for on-line help, or
'help.start()' for an HTML browser interface to help.
Type 'q()' to quit R.
> library(FSA)
############################################
## FSA package, version 0.8.7 ##
## Derek H. Ogle, Northland College ##
## ##
## Run ?FSA for documentation. ##
## Run citation('FSA') for citation ... ##
## please cite if used in publication. ##
## ##
## See derekogle.com/fishR/ for more ##
## thorough analytical vignettes. ##
############################################
> png(filename="/home/ddbj/snapshot/RGM3/R_CC/result/FSA/chapmanRobson.Rd_%03d_medium.png", width=480, height=480)
> ### Name: chapmanRobson
> ### Title: Computes Chapman-Robson estimates of S and Z.
> ### Aliases: chapmanRobson chapmanRobson.default chapmanRobson.formula
> ### confint.chapmanRobson plot.chapmanRobson summary.chapmanRobson
> ### Keywords: htest manip
>
> ### ** Examples
>
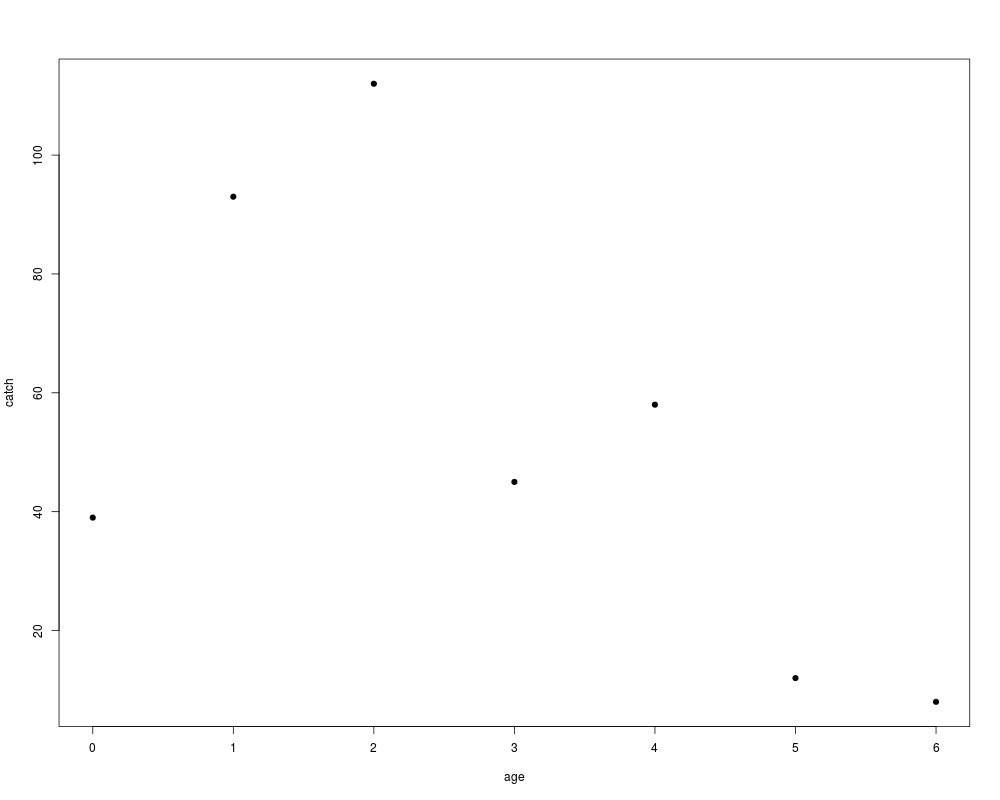
> data(BrookTroutTH)
> plot(catch~age,data=BrookTroutTH,pch=19)
>
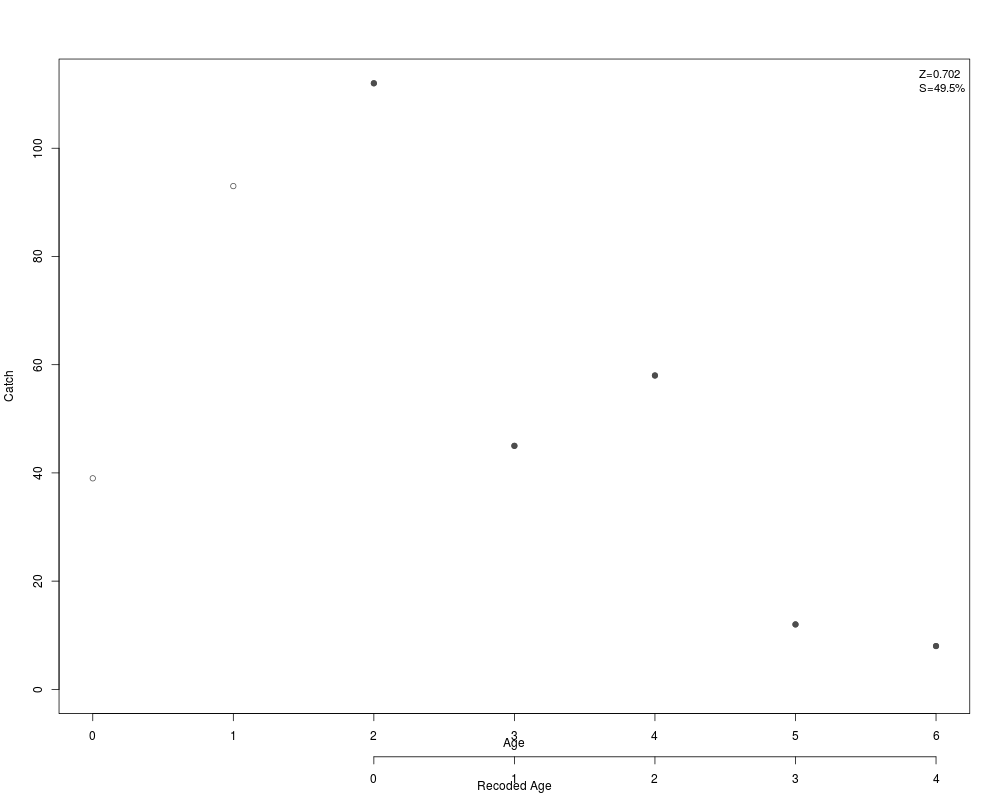
> ## demonstration of formula notation
> cr1 <- chapmanRobson(catch~age,data=BrookTroutTH,ages2use=2:6)
> summary(cr1)
Estimate Std. Error
S 49.4600432 2.3260749
Z 0.7018264 0.1153428
> summary(cr1,verbose=TRUE)
Intermediate statistics: n=235; T=229
Estimate Std. Error
S 49.4600432 2.3260749
Z 0.7018264 0.1153428
> confint(cr1)
95% LCI 95% UCI
S 44.9010202 54.0190662
Z 0.4757586 0.9278941
> plot(cr1)
>
> ## demonstration of excluding ages2use
> cr2 <- chapmanRobson(catch~age,data=BrookTroutTH,ages2use=-c(0,1))
> summary(cr2)
Estimate Std. Error
S 49.4600432 2.3260749
Z 0.7018264 0.1153428
> plot(cr2)
>
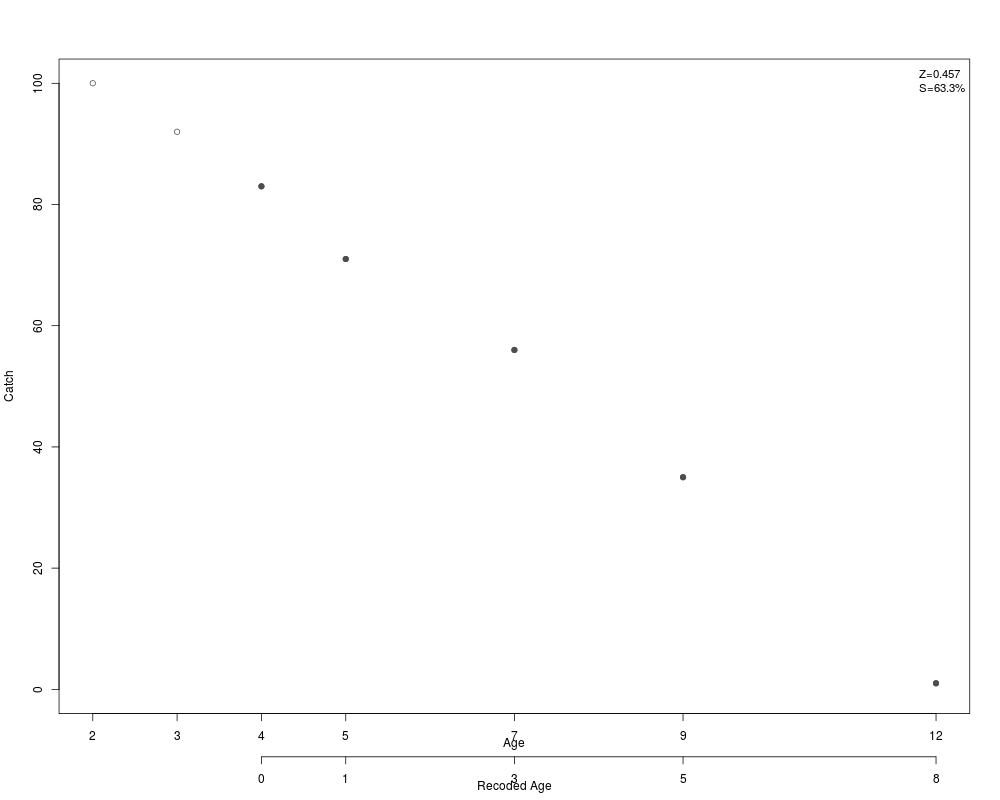
> ## demonstration of ability to work with missing age classes
> age <- c( 2, 3, 4, 5, 7, 9,12)
> ct <- c(100,92,83,71,56,35, 1)
> cr3 <- chapmanRobson(age,ct,4:12)
Warning message:
Some 'ages2use' not in observed ages.
> summary(cr3)
Estimate Std. Error
S 63.2683658 1.8679976
Z 0.4569234 0.1465991
> plot(cr3)
>
>
>
>
>
>
> dev.off()
null device
1
>
|