Supported by Dr. Osamu Ogasawara and  . . |
|
Last data update: 2014.03.03 |
Correspondence Analysis (CA)DescriptionPerforms Correspondence Analysis (CA) including supplementary row and/or column points. Usage
CA(X, ncp = 5, row.sup = NULL, col.sup = NULL,
    quanti.sup=NULL, quali.sup = NULL, graph = TRUE,
	axes = c(1,2), row.w = NULL, excl=NULL)
Arguments
ValueReturns a list including:
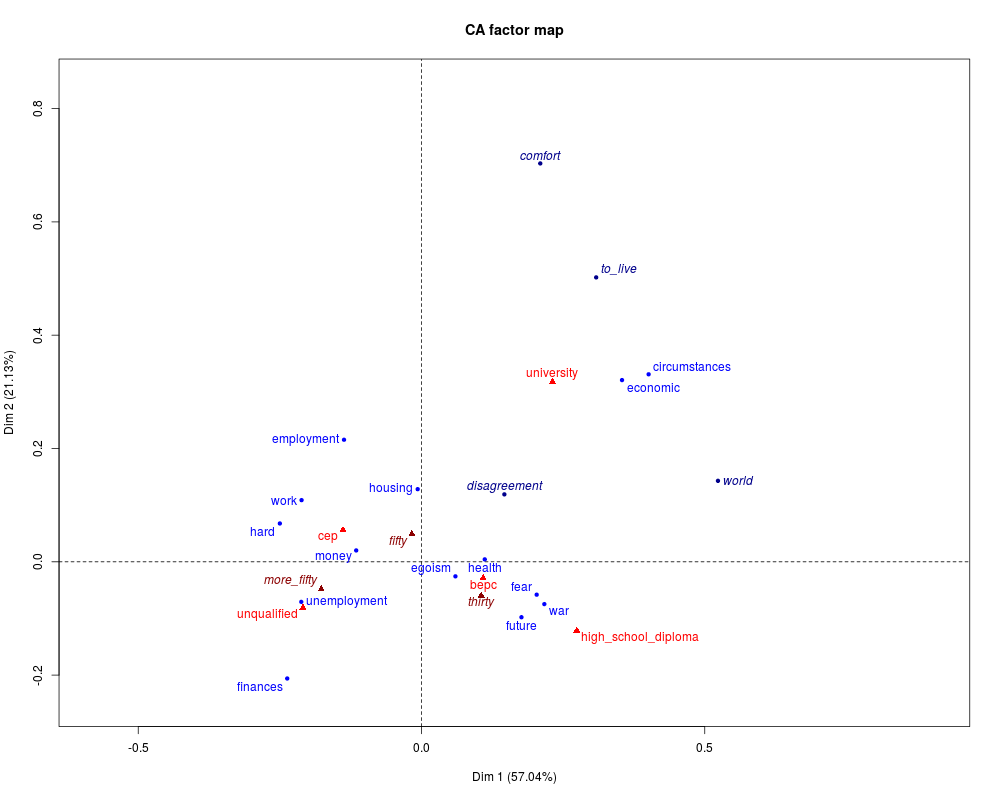
Returns the row and column points factor map. Author(s)Francois Husson Francois.Husson@agrocampus-ouest.fr,Jeremy Mazet ReferencesBenzecri, J.-P. (1992) Correspondence Analysis Handbook, New-York : Dekker See Also
Examples
data(children)
res.ca <- CA (children, row.sup = 15:18, col.sup = 6:8)
summary(res.ca)
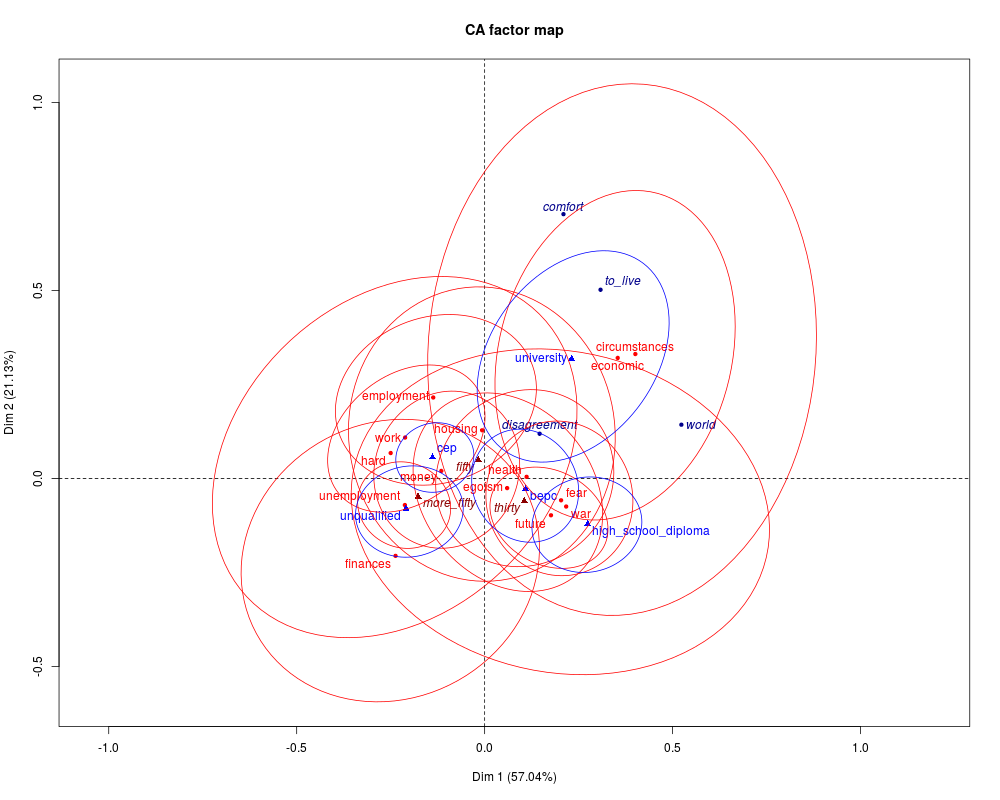
## Ellipses for all the active elements
ellipseCA(res.ca)
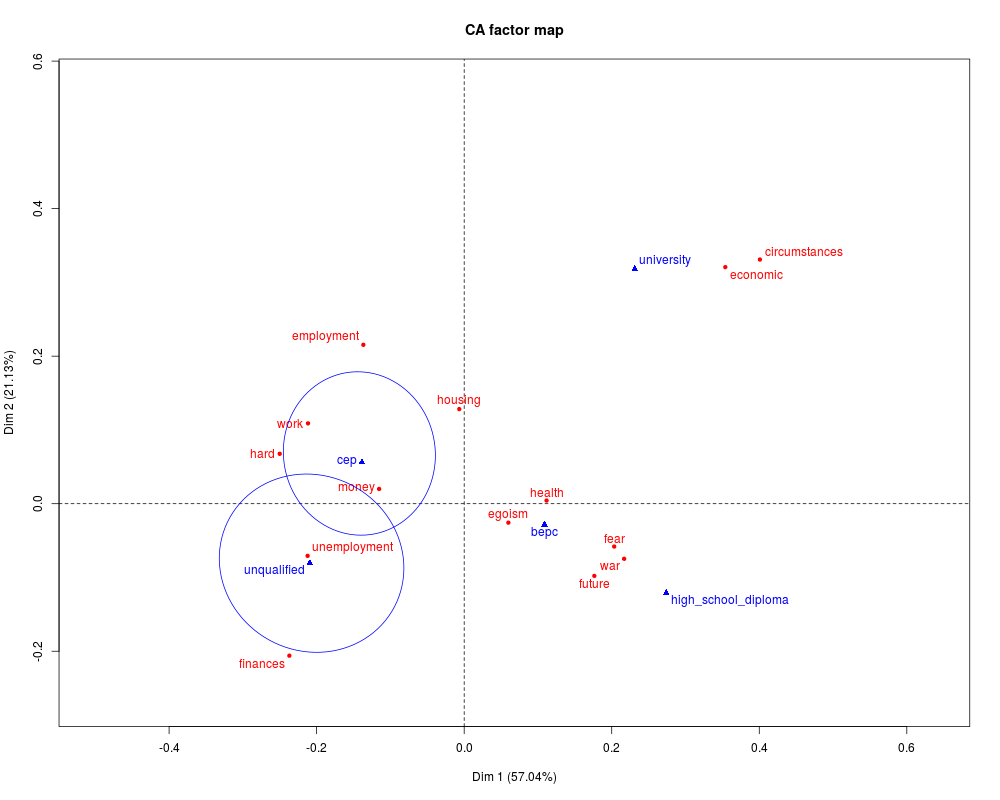
## Ellipses around some columns only
ellipseCA(res.ca,ellipse="col",col.col.ell=c(rep("blue",2),rep("transparent",3)),
invisible=c("row.sup","col.sup"))
Results
R version 3.3.1 (2016-06-21) -- "Bug in Your Hair"
Copyright (C) 2016 The R Foundation for Statistical Computing
Platform: x86_64-pc-linux-gnu (64-bit)

R is free software and comes with ABSOLUTELY NO WARRANTY.
You are welcome to redistribute it under certain conditions.
Type 'license()' or 'licence()' for distribution details.

R is a collaborative project with many contributors.
Type 'contributors()' for more information and
'citation()' on how to cite R or R packages in publications.

Type 'demo()' for some demos, 'help()' for on-line help, or
'help.start()' for an HTML browser interface to help.
Type 'q()' to quit R.

> library(FactoMineR)
> png(filename="/home/ddbj/snapshot/RGM3/R_CC/result/FactoMineR/CA.Rd_%03d_medium.png", width=480, height=480)
> ### Name: CA
> ### Title: Correspondence Analysis (CA)
> ### Aliases: CA
> ### Keywords: multivariate
>
> ### ** Examples
>
> data(children)
> res.ca <- CA (children, row.sup = 15:18, col.sup = 6:8)
> summary(res.ca)

Call:
CA(X = children, row.sup = 15:18, col.sup = 6:8)

The chi square of independence between the two variables is equal to 98.80159 (p-value =  9.748064e-05 ).

Eigenvalues
                       Dim.1   Dim.2   Dim.3   Dim.4
Variance               0.035   0.013   0.007   0.006
% of var.             57.043  21.132  11.764  10.061
Cumulative % of var.  57.043  78.175  89.939 100.000

Rows (the 10 first)
                      Iner*1000    Dim.1    ctr   cos2    Dim.2    ctr   cos2
money               |     3.759 | -0.115  4.550  0.428 |  0.020  0.371  0.013 |
future              |     8.690 |  0.176 17.567  0.716 | -0.098 14.587  0.220 |
unemployment        |     9.151 | -0.212 22.616  0.875 | -0.071  6.779  0.097 |
circumstances       |     3.804 |  0.401  6.274  0.584 |  0.331 11.544  0.398 |
hard                |     1.199 | -0.250  2.994  0.884 |  0.068  0.592  0.065 |
economic            |     8.787 |  0.354 12.005  0.484 |  0.321 26.604  0.397 |
egoism              |     3.287 |  0.060  0.681  0.073 | -0.026  0.338  0.013 |
employment          |     5.648 | -0.137  2.621  0.164 |  0.215 17.555  0.408 |
finances            |     3.576 | -0.237  2.790  0.276 | -0.206  5.690  0.209 |
war                 |     1.025 |  0.217  2.169  0.749 | -0.075  0.694  0.089 |
                     Dim.3    ctr   cos2
money                0.101 16.884  0.328 |
future              -0.053  7.568  0.064 |
unemployment        -0.004  0.046  0.000 |
circumstances       -0.016  0.046  0.001 |
hard                 0.060  0.845  0.051 |
economic             0.084  3.280  0.027 |
egoism               0.179 29.496  0.655 |
employment          -0.213 30.815  0.398 |
finances            -0.044  0.469  0.010 |
war                 -0.098  2.139  0.152 |

Columns
                      Iner*1000    Dim.1    ctr   cos2    Dim.2    ctr   cos2
unqualified         |    13.146 | -0.209 25.110  0.676 | -0.081 10.082  0.101 |
cep                 |    10.044 | -0.139 18.297  0.645 |  0.056  8.079  0.105 |
bepc                |     7.670 |  0.109  6.758  0.312 | -0.028  1.251  0.021 |
high_school_diploma |    17.732 |  0.274 37.976  0.758 | -0.121 20.099  0.149 |
university          |    13.468 |  0.231 11.859  0.312 |  0.318 60.488  0.589 |
                     Dim.3    ctr   cos2
unqualified          0.073 14.659  0.081 |
cep                 -0.018  1.520  0.011 |
bepc                -0.147 59.874  0.570 |
high_school_diploma  0.077 14.407  0.059 |
university           0.094  9.540  0.052 |

Supplementary rows
                      Dim.1  cos2   Dim.2  cos2   Dim.3  cos2
comfort             | 0.210 0.069 | 0.703 0.775 | 0.071 0.008 |
disagreement        | 0.146 0.131 | 0.119 0.087 | 0.171 0.180 |
world               | 0.523 0.876 | 0.143 0.065 | 0.084 0.023 |
to_live             | 0.308 0.139 | 0.502 0.369 | 0.521 0.397 |

Supplementary columns
                       Dim.1   cos2    Dim.2   cos2    Dim.3   cos2
thirty              |  0.105  0.138 | -0.060  0.044 | -0.103  0.132 |
fifty               | -0.017  0.011 |  0.049  0.090 | -0.016  0.009 |
more_fifty          | -0.177  0.286 | -0.048  0.021 |  0.101  0.093 |
> ## Ellipses for all the active elements
> ellipseCA(res.ca)
> ## Ellipses around some columns only
> ellipseCA(res.ca,ellipse="col",col.col.ell=c(rep("blue",2),rep("transparent",3)),
+      invisible=c("row.sup","col.sup"))
>
>
>
>
>
> dev.off()
null device
          1
>
|