Supported by Dr. Osamu Ogasawara and  . . |
|
Last data update: 2014.03.03 |
Dual Multiple Factor Analysis (DMFA)DescriptionPerforms Dual Multiple Factor Analysis (DMFA) with supplementary individuals, supplementary quantitative variables and supplementary categorical variables. Usage
DMFA(don, num.fact = ncol(don), scale.unit = TRUE, ncp = 5,
    quanti.sup = NULL, quali.sup = NULL, graph = TRUE, axes=c(1,2))
Arguments
ValueReturns a list including:
Returns the individuals factor map and the variables factor map. Author(s)Francois Husson Francois.Husson@agrocampus-ouest.fr See Also
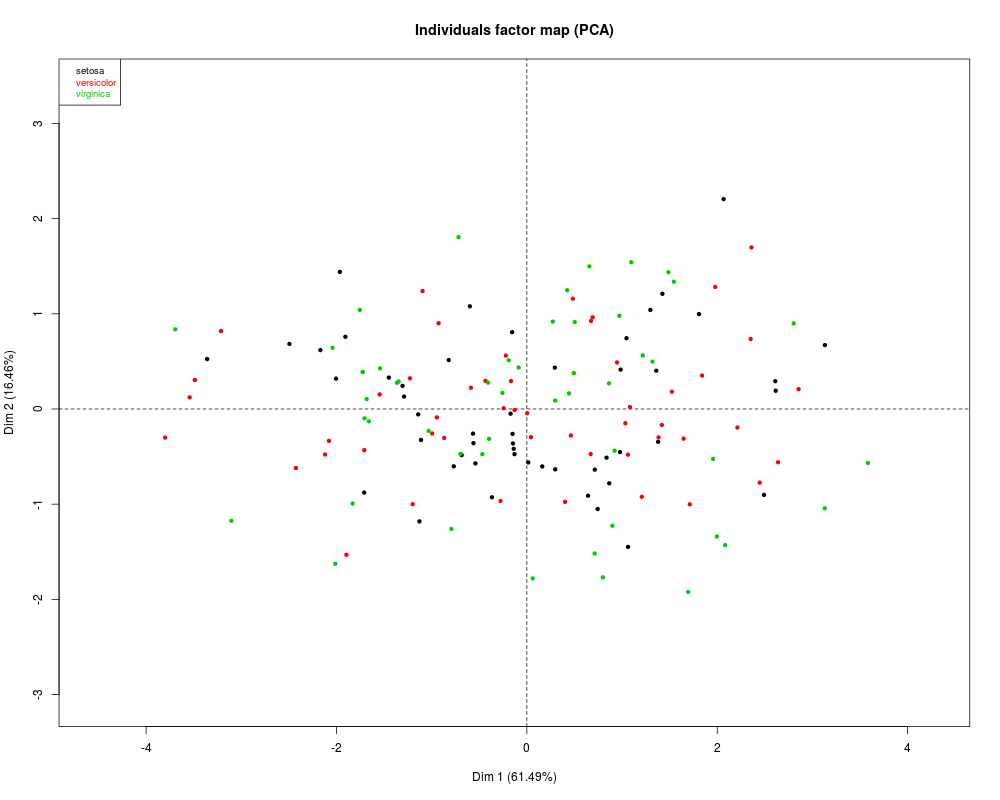
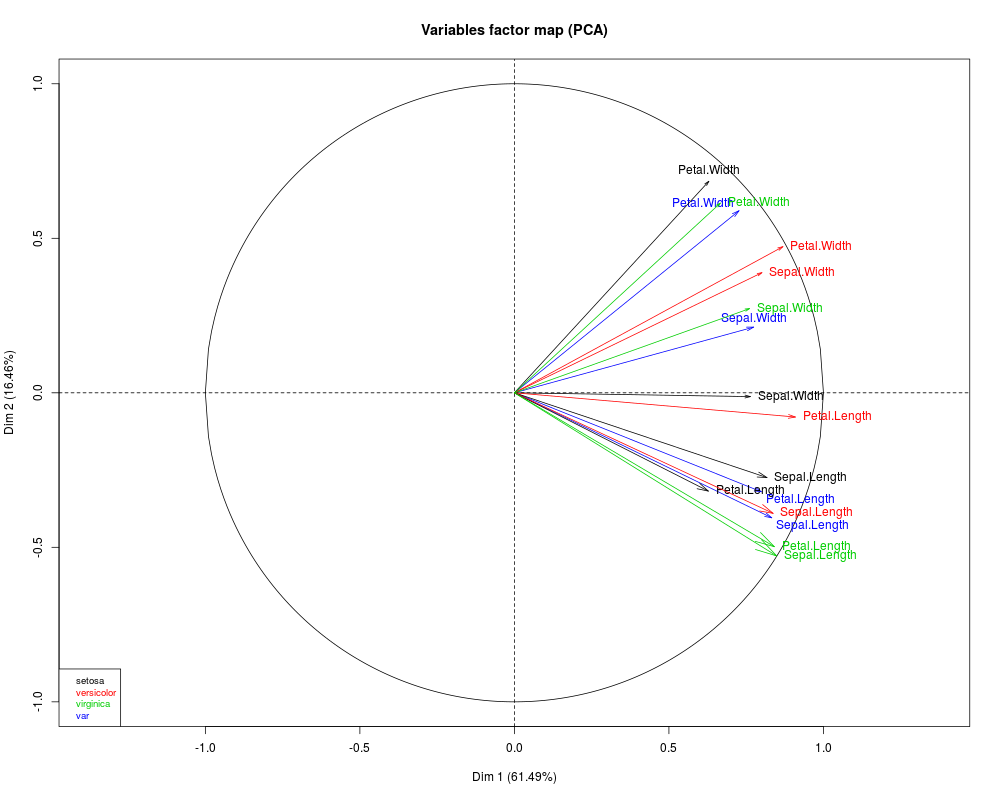
Examples## Example with the famous Fisher's iris data res.dmfa = DMFA ( iris, num.fact = 5) ResultsR version 3.3.1 (2016-06-21) -- "Bug in Your Hair" Copyright (C) 2016 The R Foundation for Statistical Computing Platform: x86_64-pc-linux-gnu (64-bit) R is free software and comes with ABSOLUTELY NO WARRANTY. You are welcome to redistribute it under certain conditions. Type 'license()' or 'licence()' for distribution details. R is a collaborative project with many contributors. Type 'contributors()' for more information and 'citation()' on how to cite R or R packages in publications. Type 'demo()' for some demos, 'help()' for on-line help, or 'help.start()' for an HTML browser interface to help. Type 'q()' to quit R. > library(FactoMineR) > png(filename="/home/ddbj/snapshot/RGM3/R_CC/result/FactoMineR/DMFA.Rd_%03d_medium.png", width=480, height=480) > ### Name: DMFA > ### Title: Dual Multiple Factor Analysis (DMFA) > ### Aliases: DMFA > ### Keywords: multivariate > > ### ** Examples > > ## Example with the famous Fisher's iris data > res.dmfa = DMFA ( iris, num.fact = 5) dev.new(): using pdf(file="Rplots893.pdf") dev.new(): using pdf(file="Rplots894.pdf") dev.new(): using pdf(file="Rplots895.pdf") dev.new(): using pdf(file="Rplots896.pdf") > > > > > > dev.off() png 2 >
|