a data frame containing the coordinates of the individuals
for which the confidence ellipses are constructed. This data frame can contain more than 2 variables;
the variables taken into account are chosen after. The first column must be a factor which allows
to associate one row to an ellipse. The simule object of the result of the simule function
correspond to a data frame.
centre
a data frame whose columns are the same than those of the coord.simul, and with the coordinates
of the centre of each ellipse. This parameter is optional and NULL by default; in this case,
the centre of the ellipses is calculated from the data
axes
a length 2 vector specifying the components of coord.simul that are taken into account
level.conf
confidence level used to construct the ellipses. By default, 0.95
npoint
number of points used to draw the ellipses
bary
boolean, if bary = TRUE, the coordinates of the ellipse around the barycentre of individuals are calculated
Value
res
a data frame with (npoint times the number of ellipses) rows and three columns. The first column
is the factor of coord.simul, the two others columns give the coordinates of the ellipses on the two dimensions chosen.
call
the parameters of the function chosen
Author(s)
Jeremy Mazet
See Also
simule
Examples
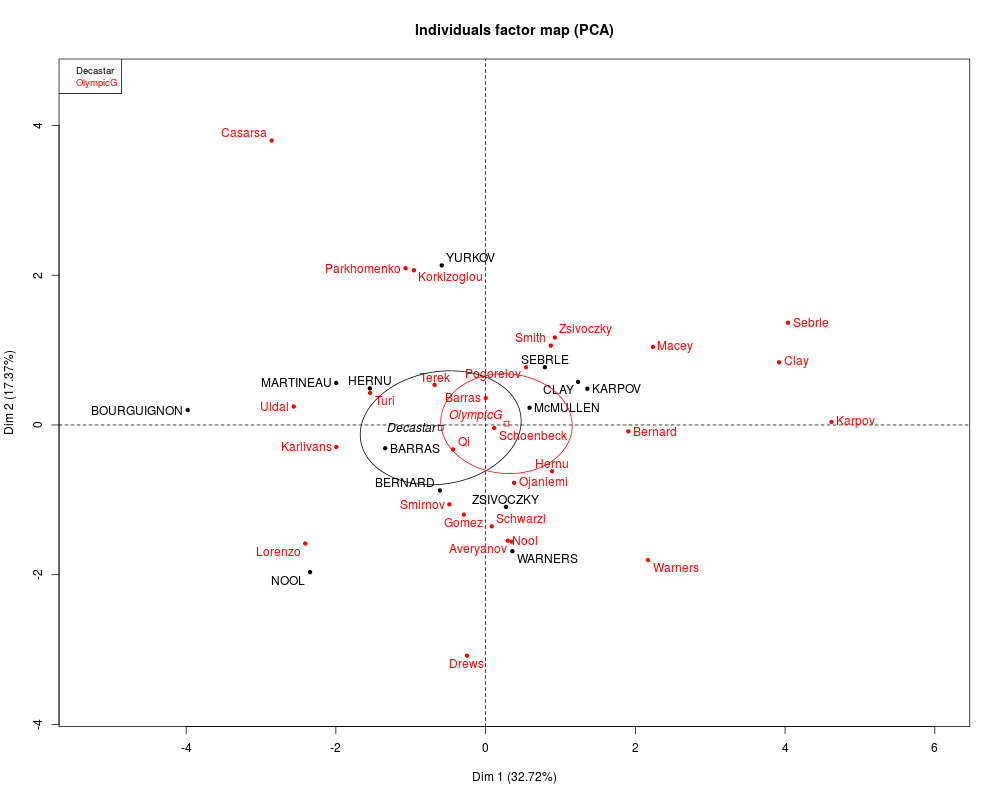
data(decathlon)
res.pca <- PCA(decathlon, quanti.sup = 11:12, quali.sup = 13,graph=FALSE)
aa <- cbind.data.frame(decathlon[,13],res.pca$ind$coord)
bb <- coord.ellipse(aa,bary=TRUE)
plot(res.pca,habillage=13,ellipse=bb)
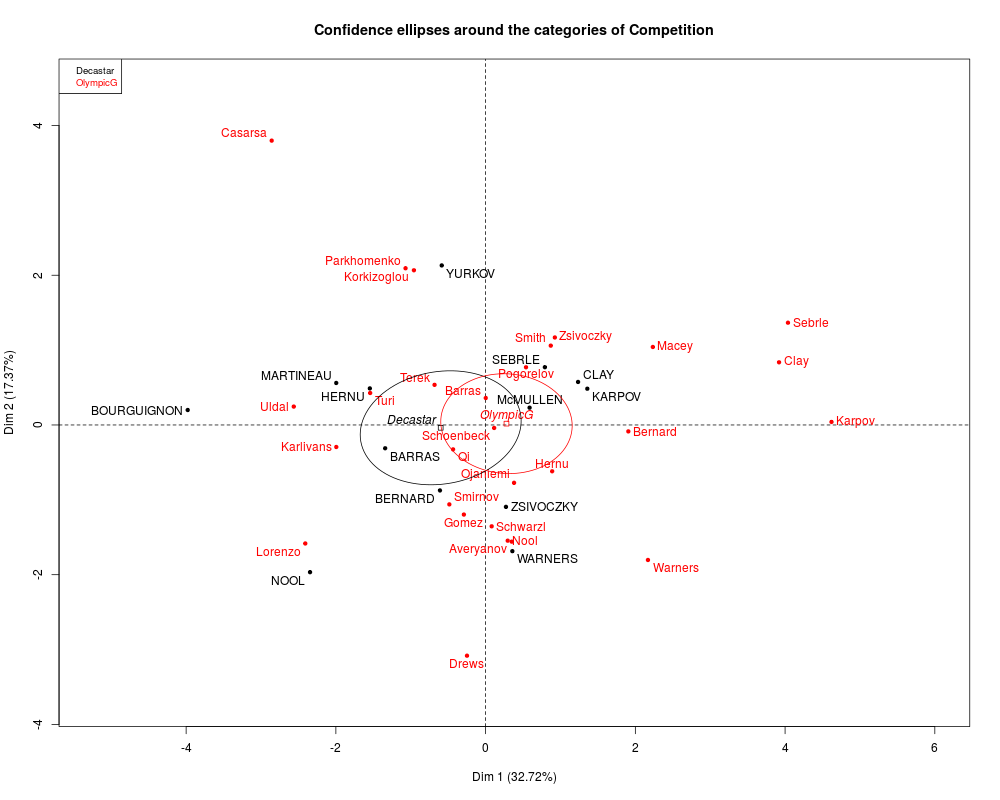
## To automatically draw ellipses around the barycentres of all the categorical variables
plotellipses(res.pca)
Results
R version 3.3.1 (2016-06-21) -- "Bug in Your Hair"
Copyright (C) 2016 The R Foundation for Statistical Computing
Platform: x86_64-pc-linux-gnu (64-bit)

R is free software and comes with ABSOLUTELY NO WARRANTY.
You are welcome to redistribute it under certain conditions.
Type 'license()' or 'licence()' for distribution details.

R is a collaborative project with many contributors.
Type 'contributors()' for more information and
'citation()' on how to cite R or R packages in publications.

Type 'demo()' for some demos, 'help()' for on-line help, or
'help.start()' for an HTML browser interface to help.
Type 'q()' to quit R.

> library(FactoMineR)
> png(filename="/home/ddbj/snapshot/RGM3/R_CC/result/FactoMineR/coord.ellipse.Rd_%03d_medium.png", width=480, height=480)
> ### Name: coord.ellipse
> ### Title: Construct confidence ellipses
> ### Aliases: coord.ellipse
> ### Keywords: dplot
>
> ### ** Examples
>
> data(decathlon)
> res.pca <- PCA(decathlon, quanti.sup = 11:12, quali.sup = 13,graph=FALSE)
> aa <- cbind.data.frame(decathlon[,13],res.pca$ind$coord)
> bb <- coord.ellipse(aa,bary=TRUE)
> plot(res.pca,habillage=13,ellipse=bb)
>
> ## To automatically draw ellipses around the barycentres of all the categorical variables
> plotellipses(res.pca)
>
>
>
>
>
> dev.off()
null device
          1
>
 .
.