Supported by Dr. Osamu Ogasawara and  . . |
|
Last data update: 2014.03.03 |
Draw confidence ellipses in CADescriptionDraw confidence ellipses in CA around rows and/or columns. Usage
ellipseCA (x, ellipse=c("col","row"), method="multinomial", nbsample=100,
    axes=c(1,2), xlim=NULL, ylim=NULL, col.row="red", col.col="blue",
	col.row.ell=col.row, col.col.ell=col.col, ...)
Arguments
DetailsWith With Thus ValueReturns the factor map with the joint plot of CA with ellipses around some elements. Author(s)Francois Husson Francois.Husson@agrocampus-ouest.fr ReferencesLebart, L., Morineau, A. and Piron, M. (1995) Statistique exploratoire multidimensionnelle, Dunod. See Also
Examples
data(children)
res.ca <- CA (children, col.sup = 6:8, row.sup = 15:18)
## Ellipses for all the active elements
ellipseCA(res.ca)
## Ellipses around some columns only
ellipseCA(res.ca,ellipse="col",col.col.ell=c(rep("blue",2),rep("transparent",3)),
     invisible=c("row.sup","col.sup"))
Results
R version 3.3.1 (2016-06-21) -- "Bug in Your Hair"
Copyright (C) 2016 The R Foundation for Statistical Computing
Platform: x86_64-pc-linux-gnu (64-bit)
R is free software and comes with ABSOLUTELY NO WARRANTY.
You are welcome to redistribute it under certain conditions.
Type 'license()' or 'licence()' for distribution details.
R is a collaborative project with many contributors.
Type 'contributors()' for more information and
'citation()' on how to cite R or R packages in publications.
Type 'demo()' for some demos, 'help()' for on-line help, or
'help.start()' for an HTML browser interface to help.
Type 'q()' to quit R.
> library(FactoMineR)
> png(filename="/home/ddbj/snapshot/RGM3/R_CC/result/FactoMineR/ellipseCA.Rd_%03d_medium.png", width=480, height=480)
> ### Name: ellipseCA
> ### Title: Draw confidence ellipses in CA
> ### Aliases: ellipseCA
> ### Keywords: multivariate
>
> ### ** Examples
>
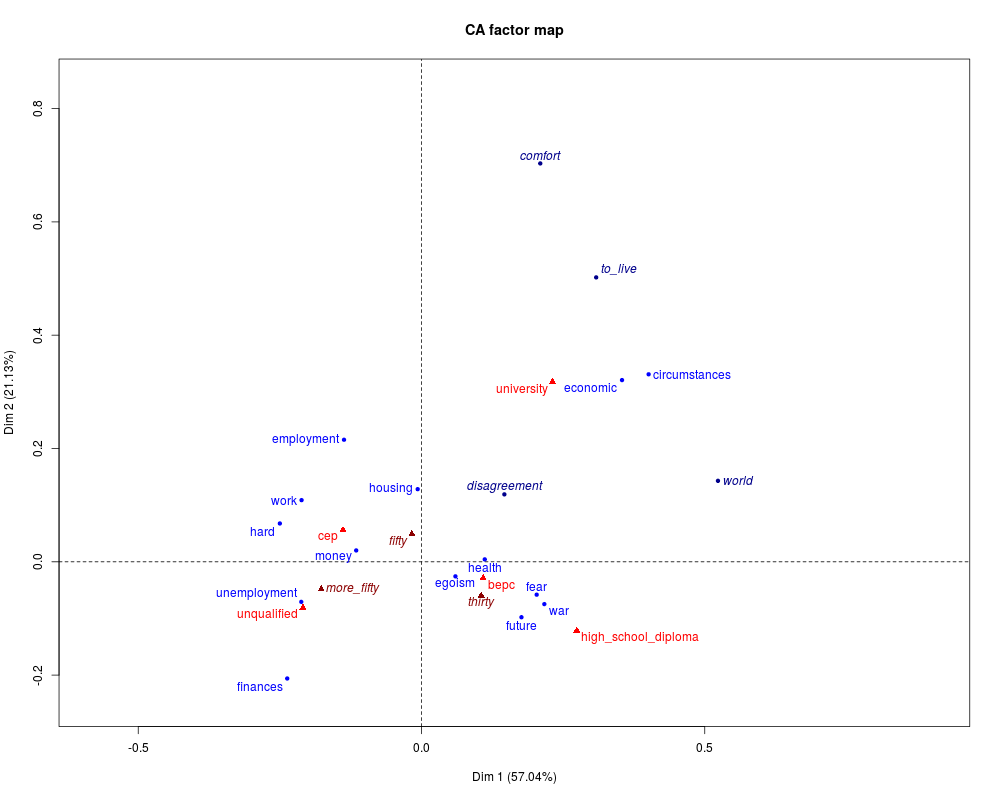
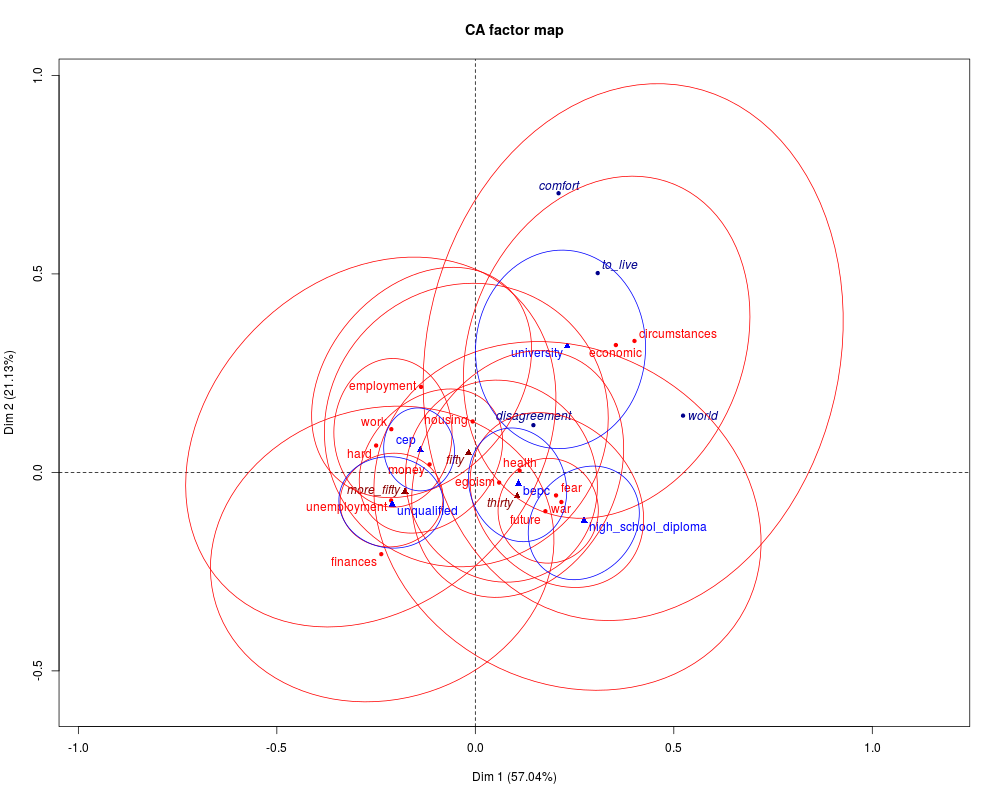
> data(children)
> res.ca <- CA (children, col.sup = 6:8, row.sup = 15:18)
> ## Ellipses for all the active elements
> ellipseCA(res.ca)
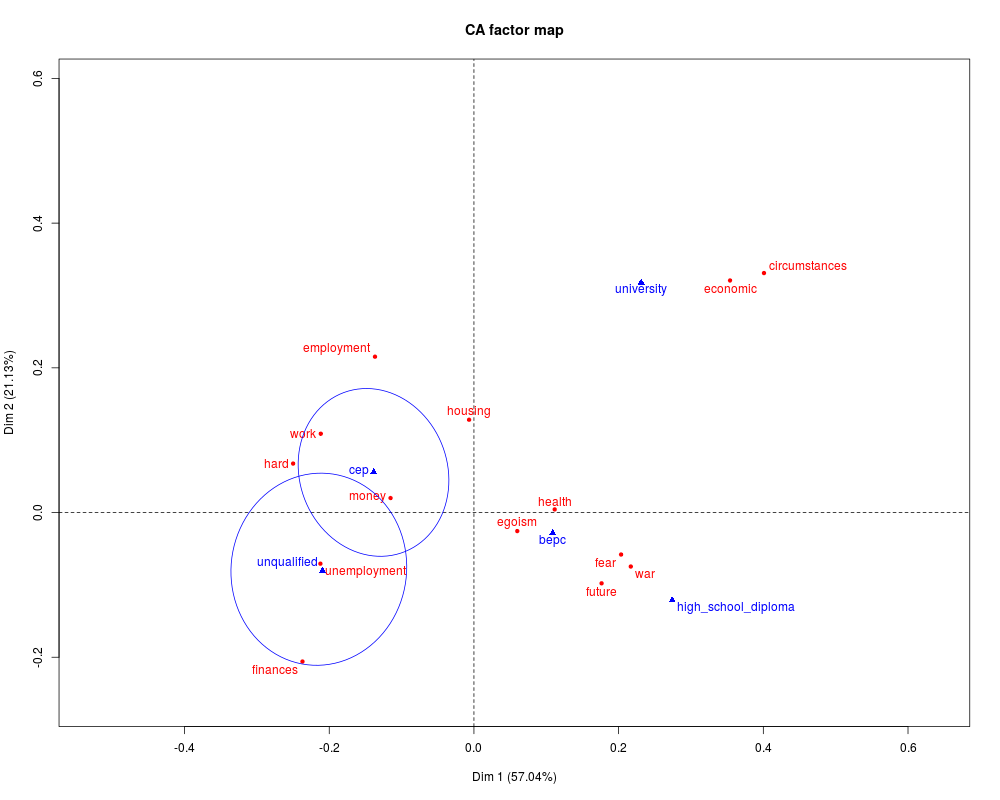
> ## Ellipses around some columns only
> ellipseCA(res.ca,ellipse="col",col.col.ell=c(rep("blue",2),rep("transparent",3)),
+ invisible=c("row.sup","col.sup"))
>
>
>
>
>
> dev.off()
null device
1
>
|