Supported by Dr. Osamu Ogasawara and  . . |
|
Last data update: 2014.03.03 |
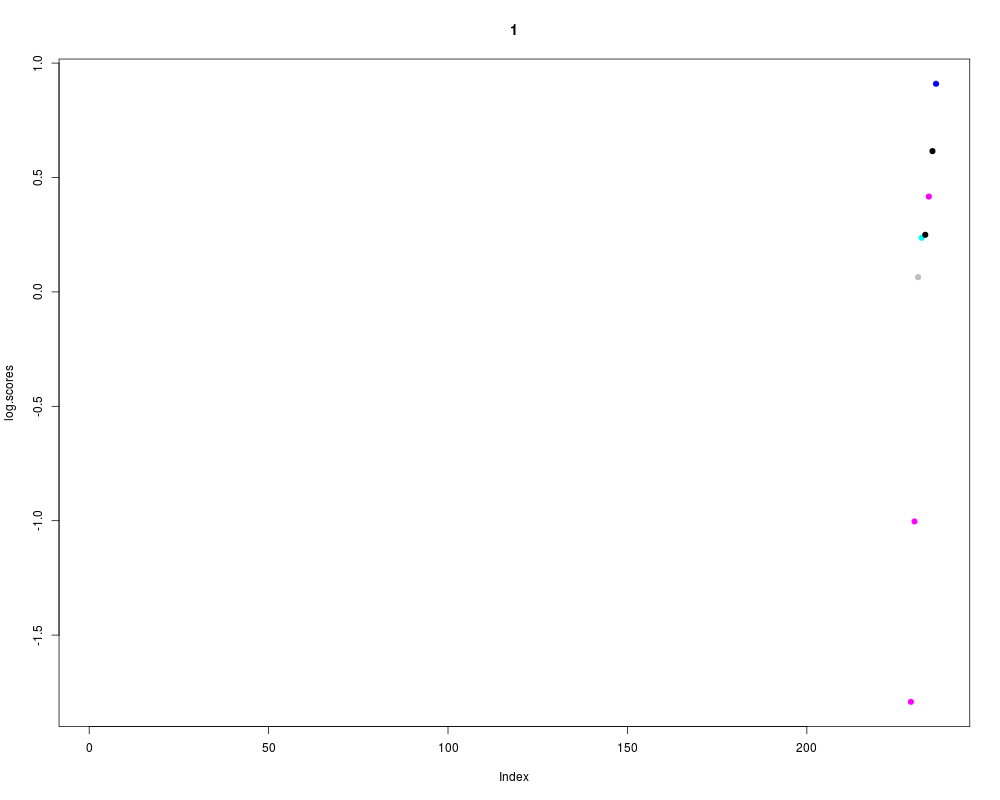
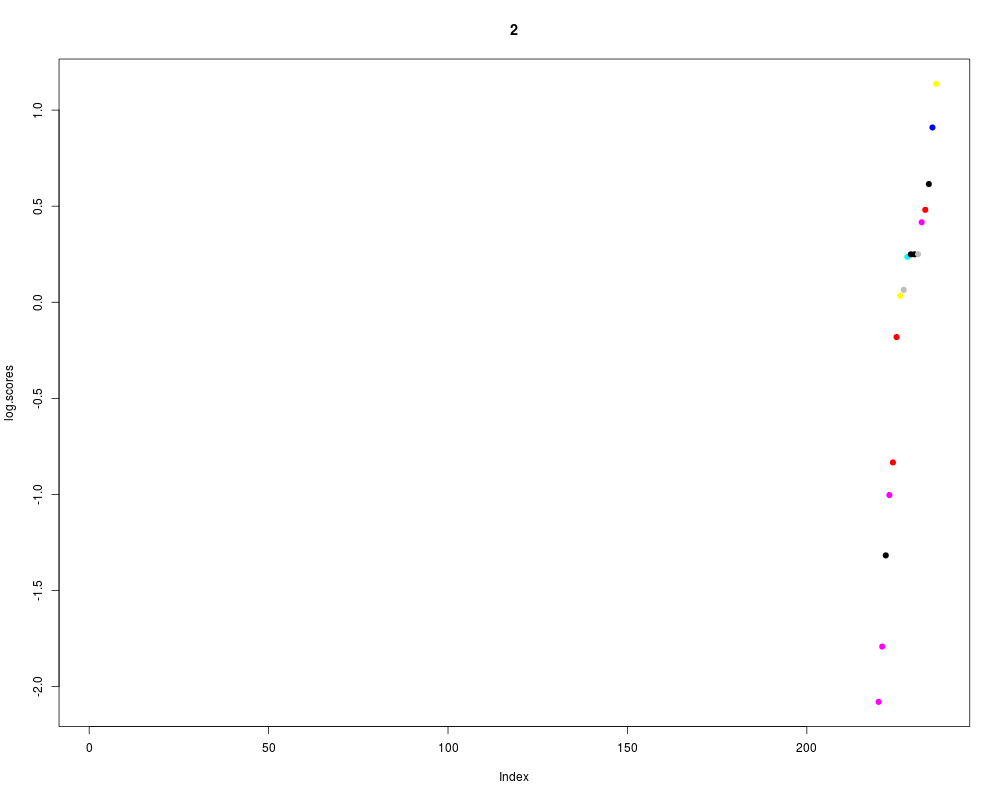
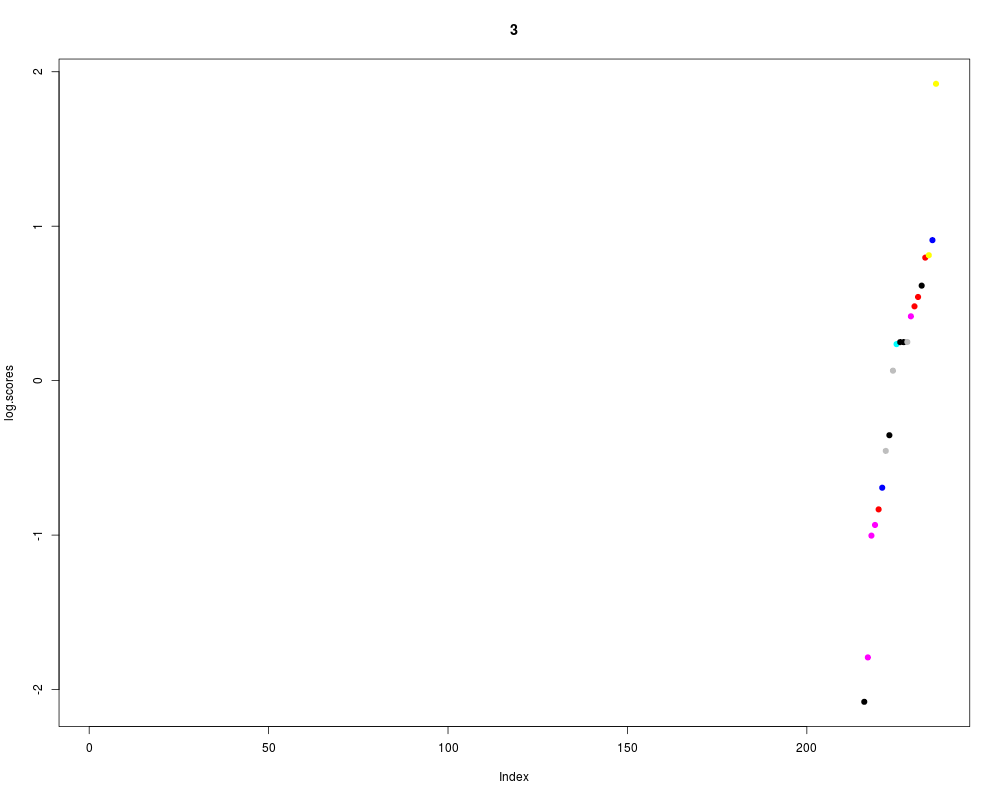
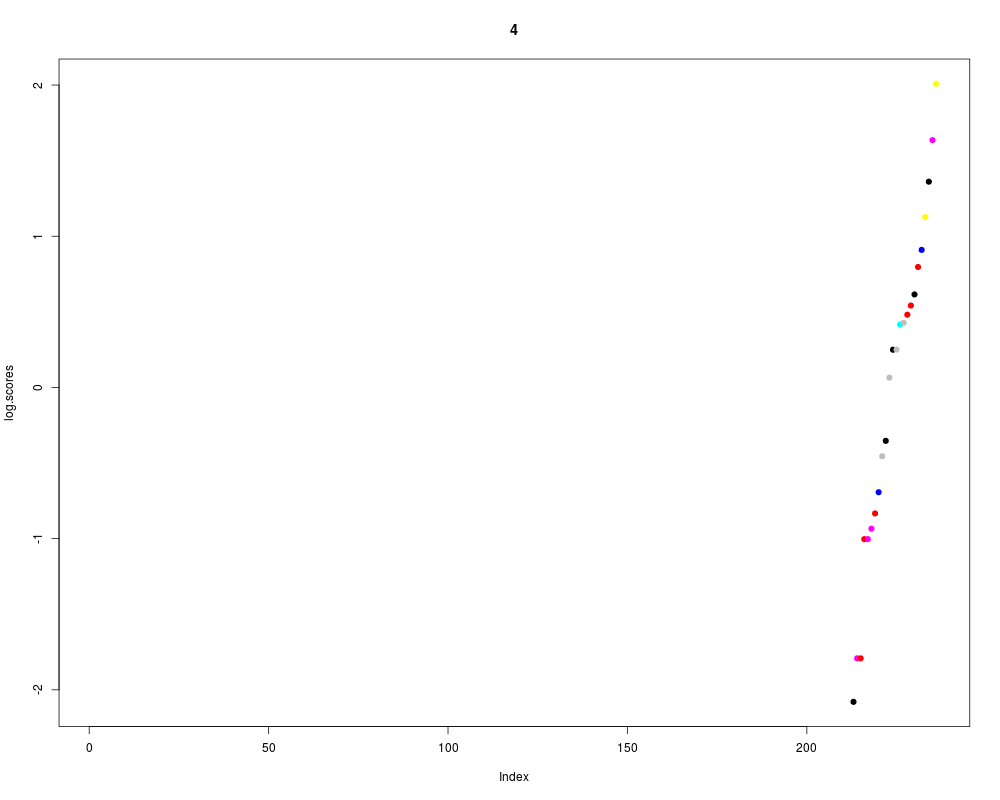
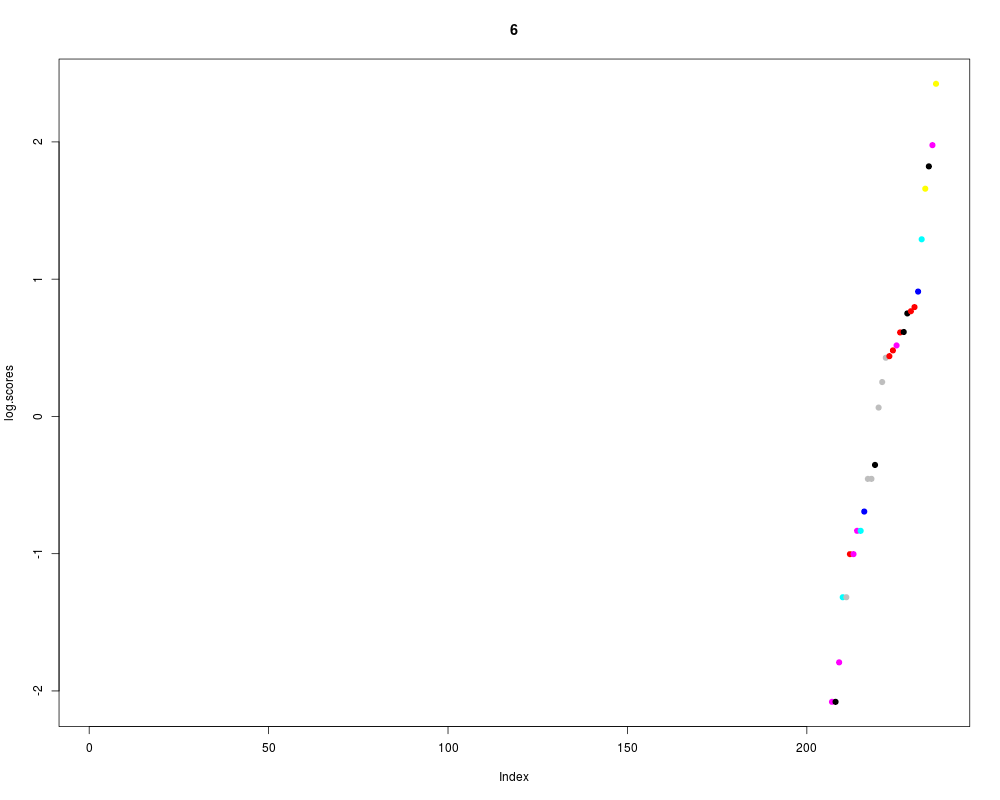
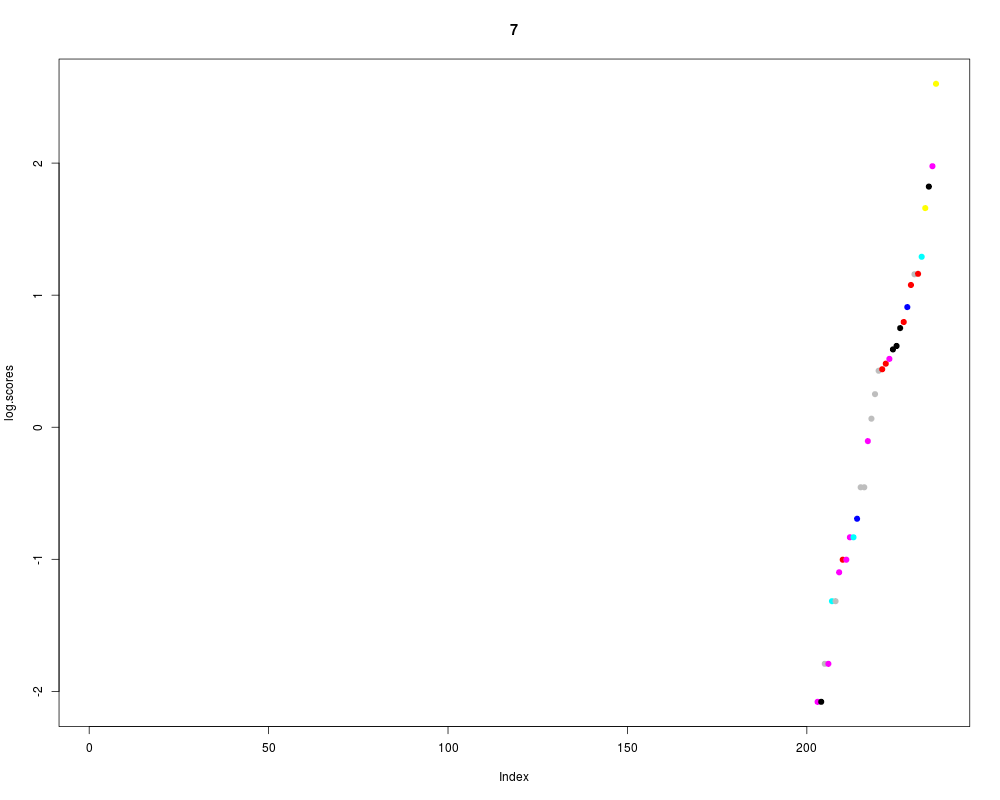
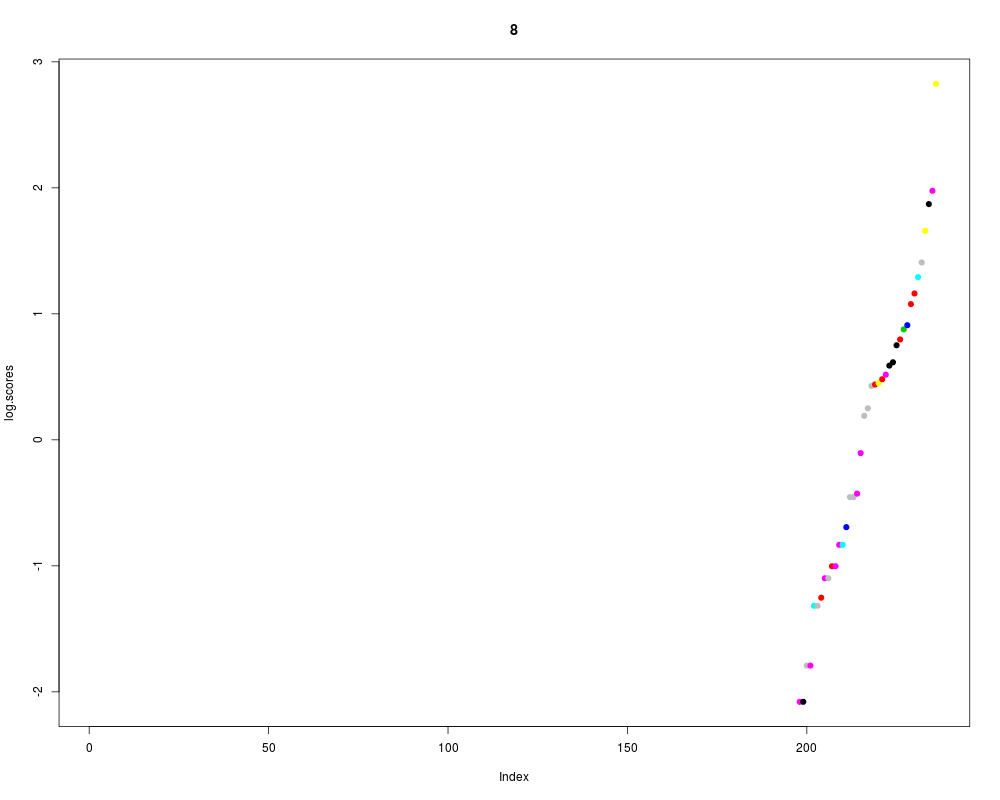
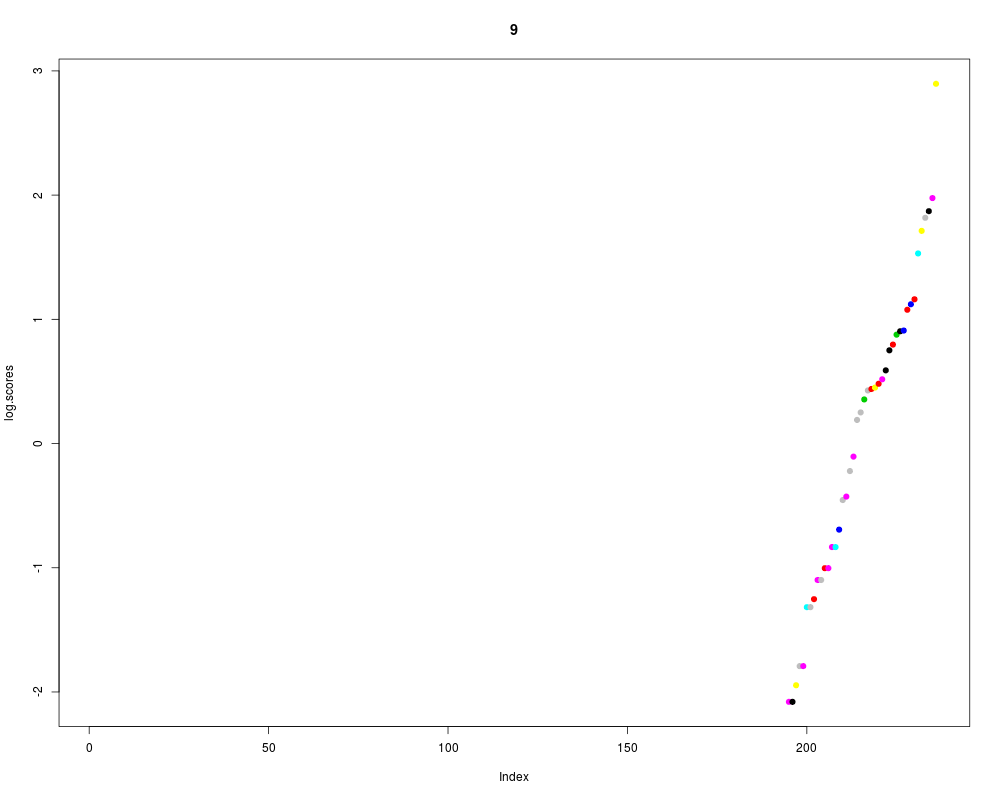
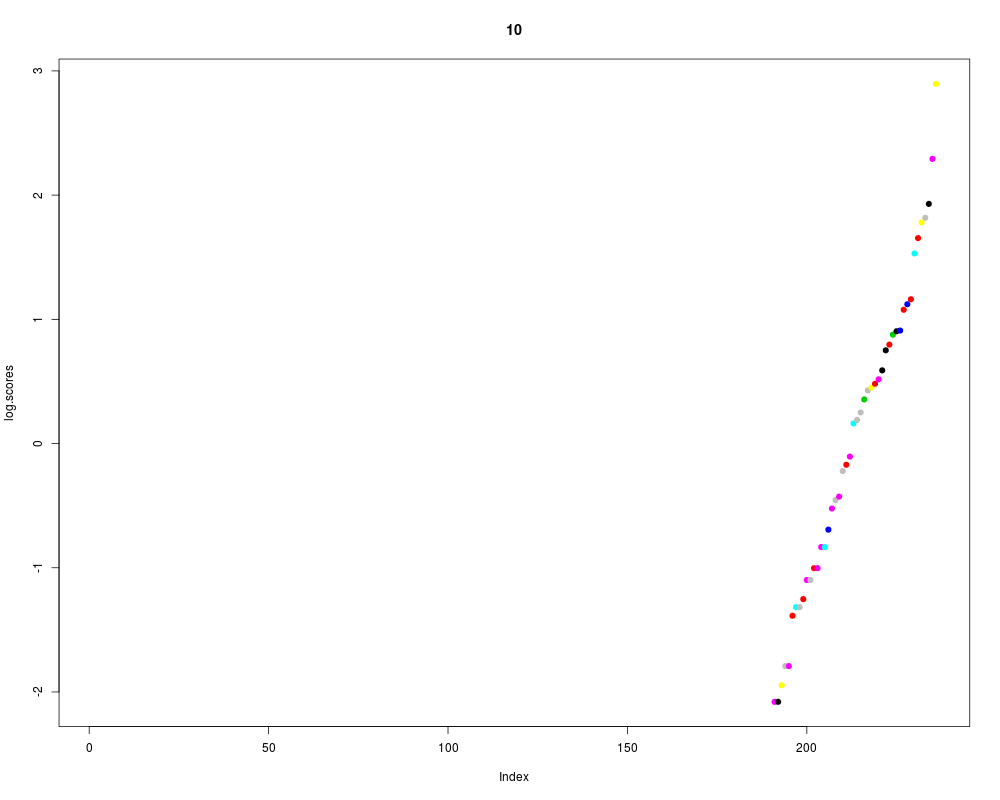
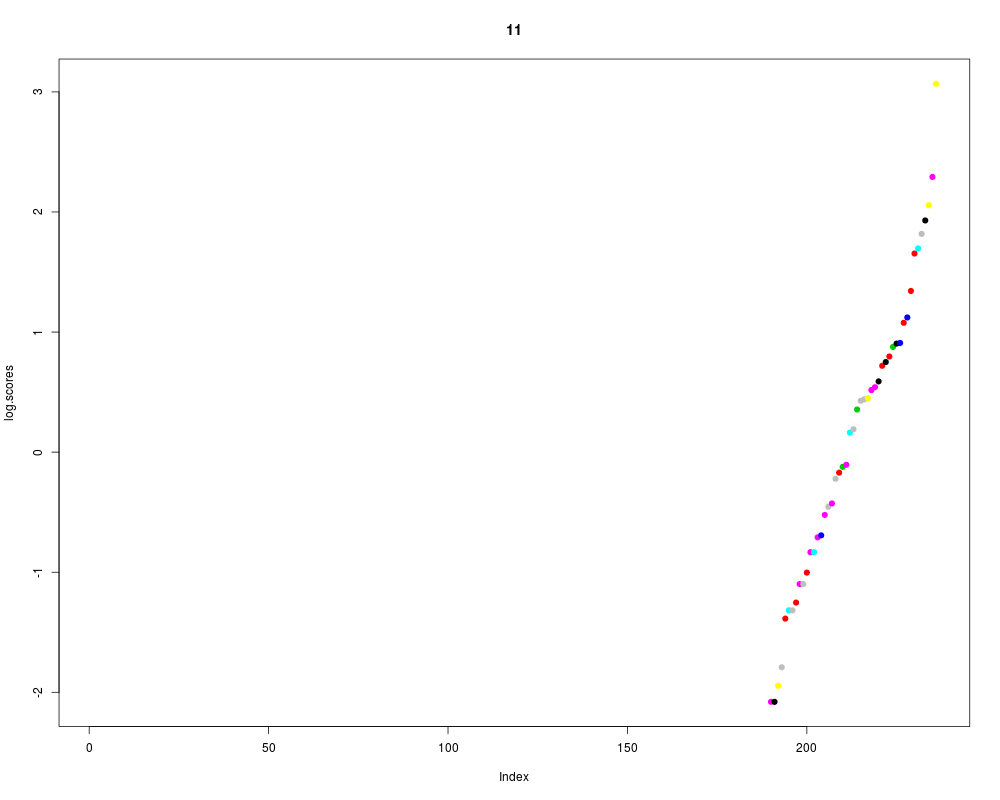
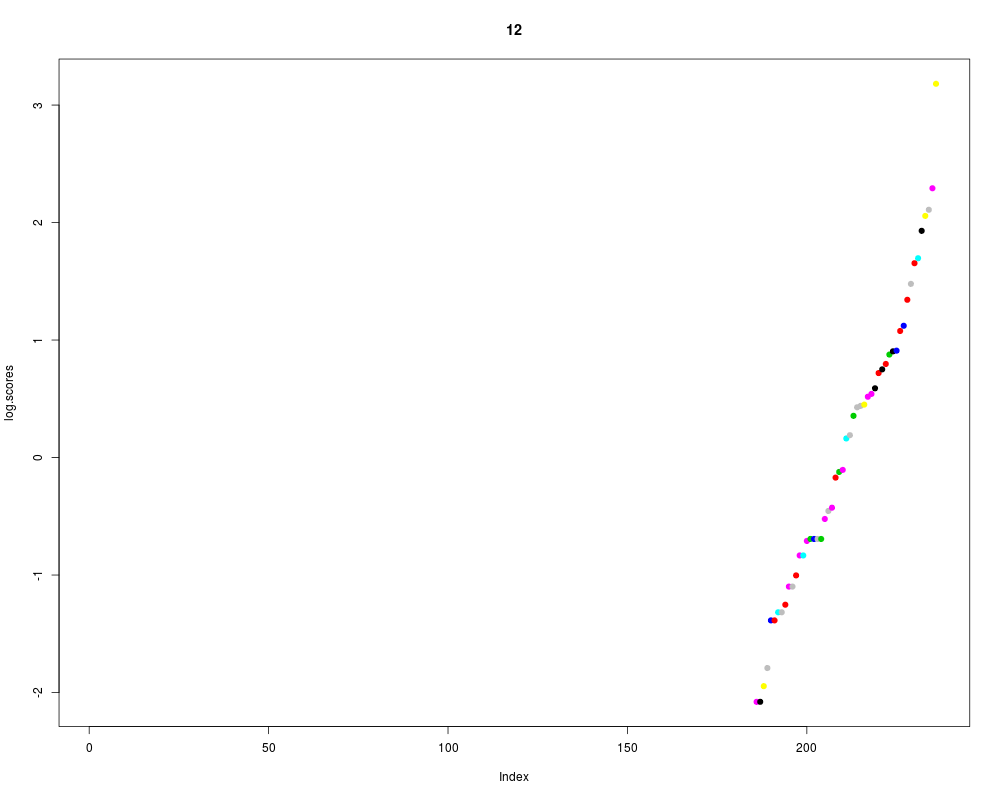
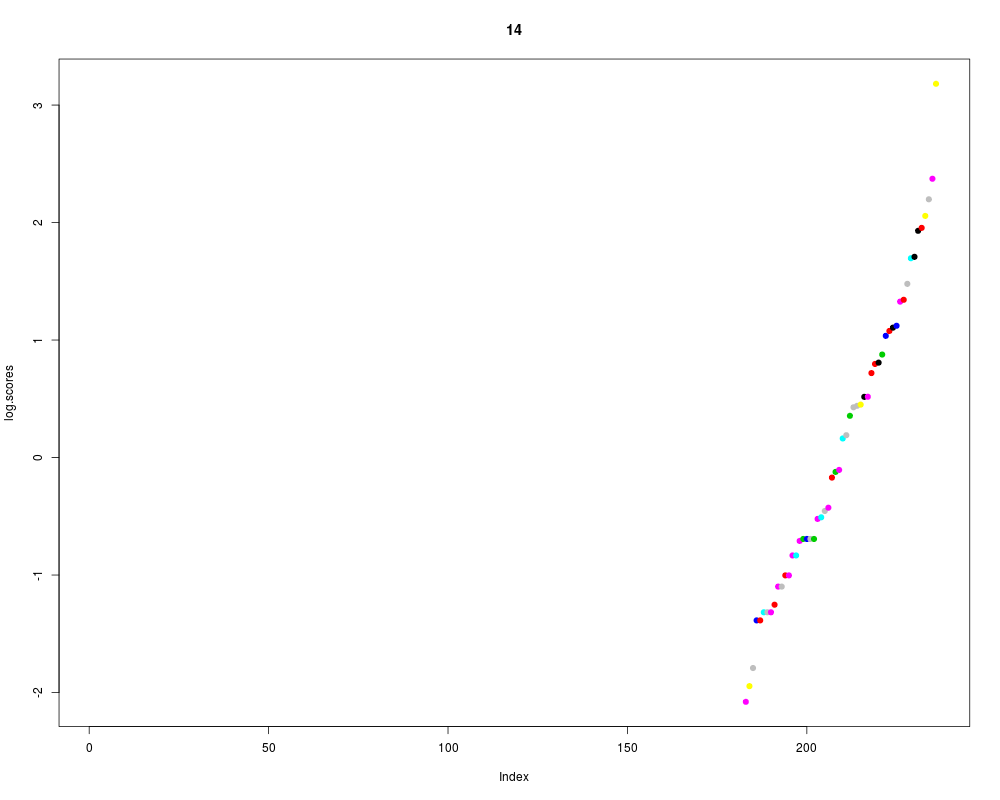
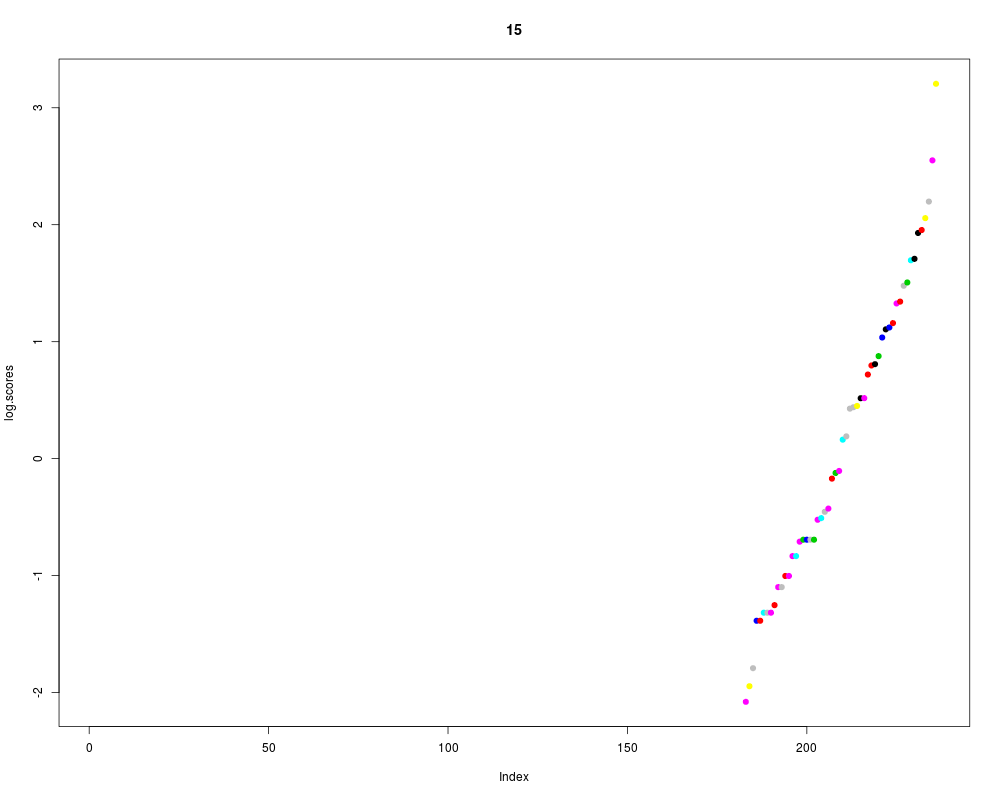
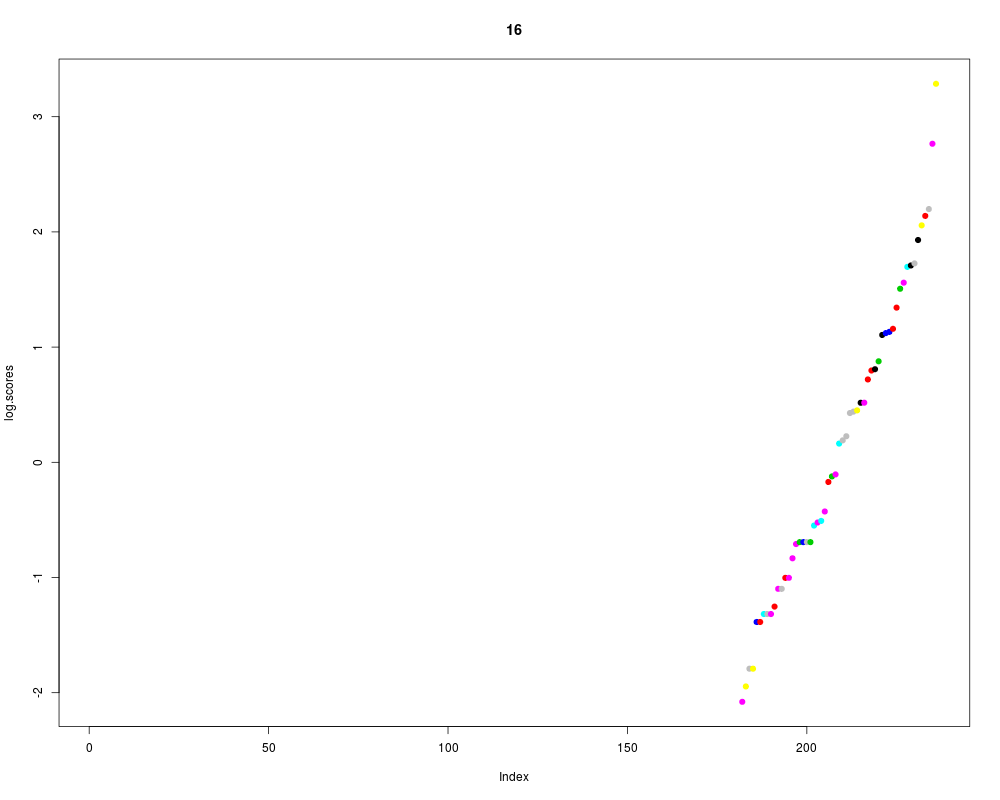
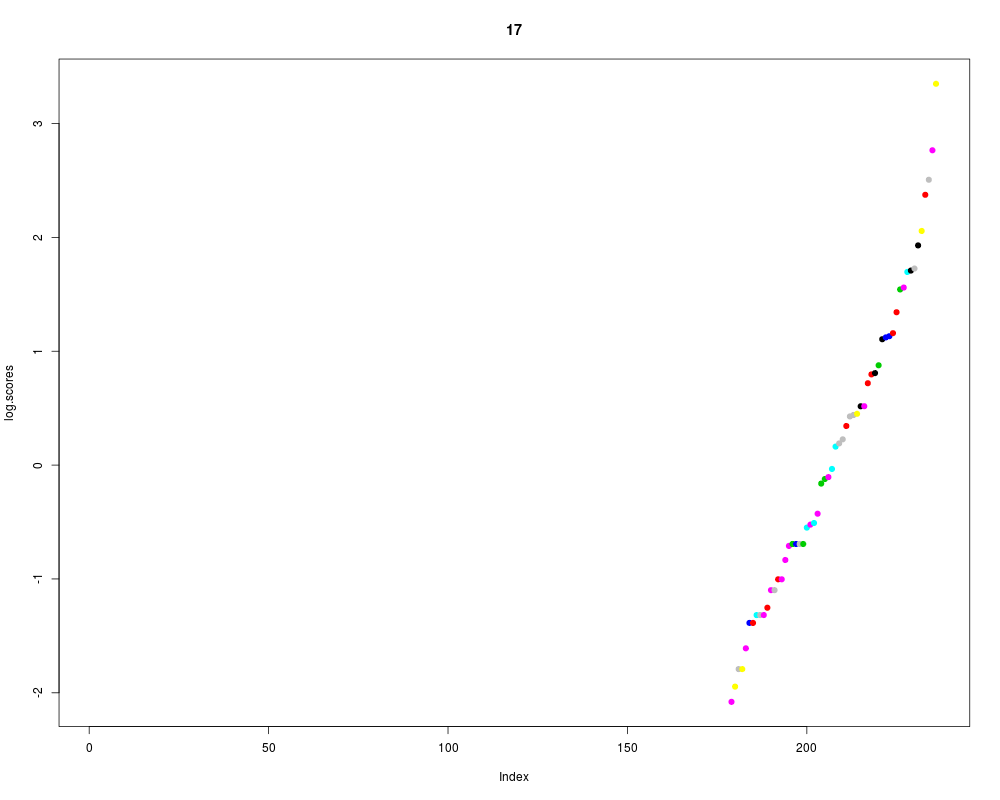
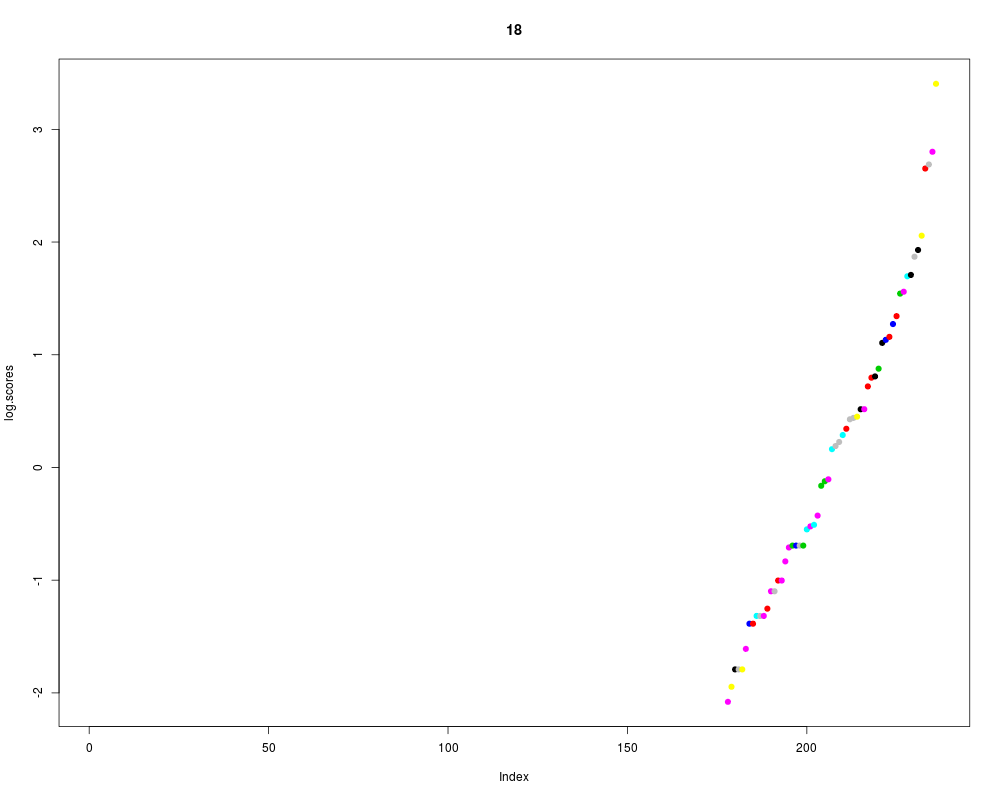
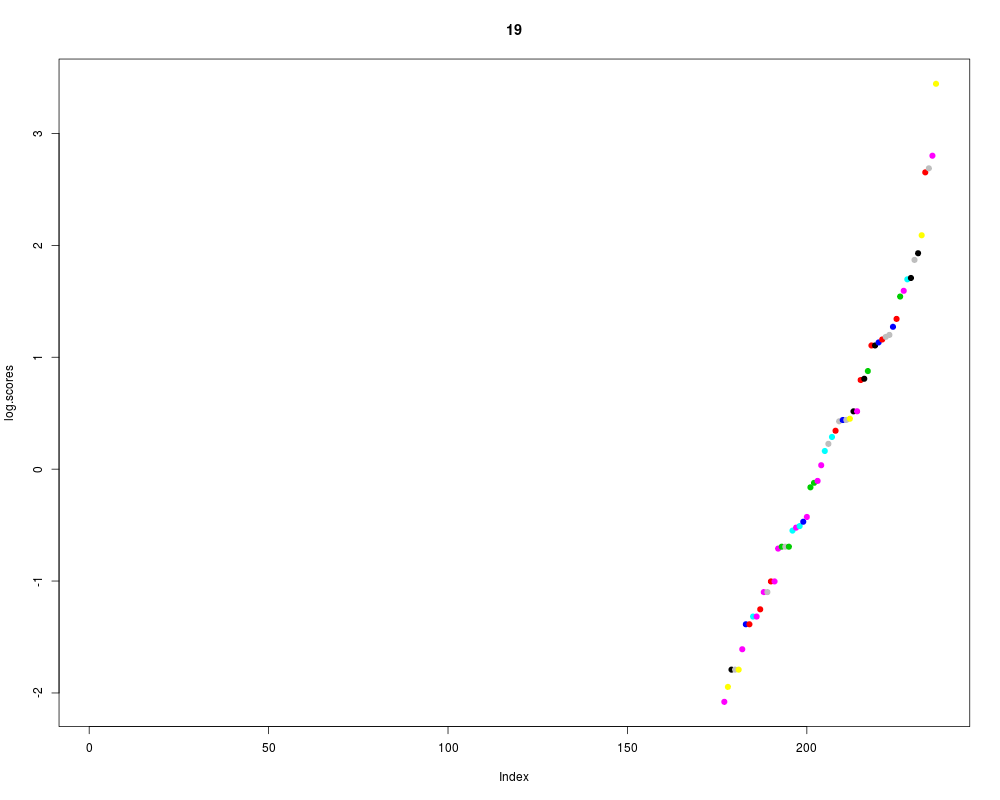
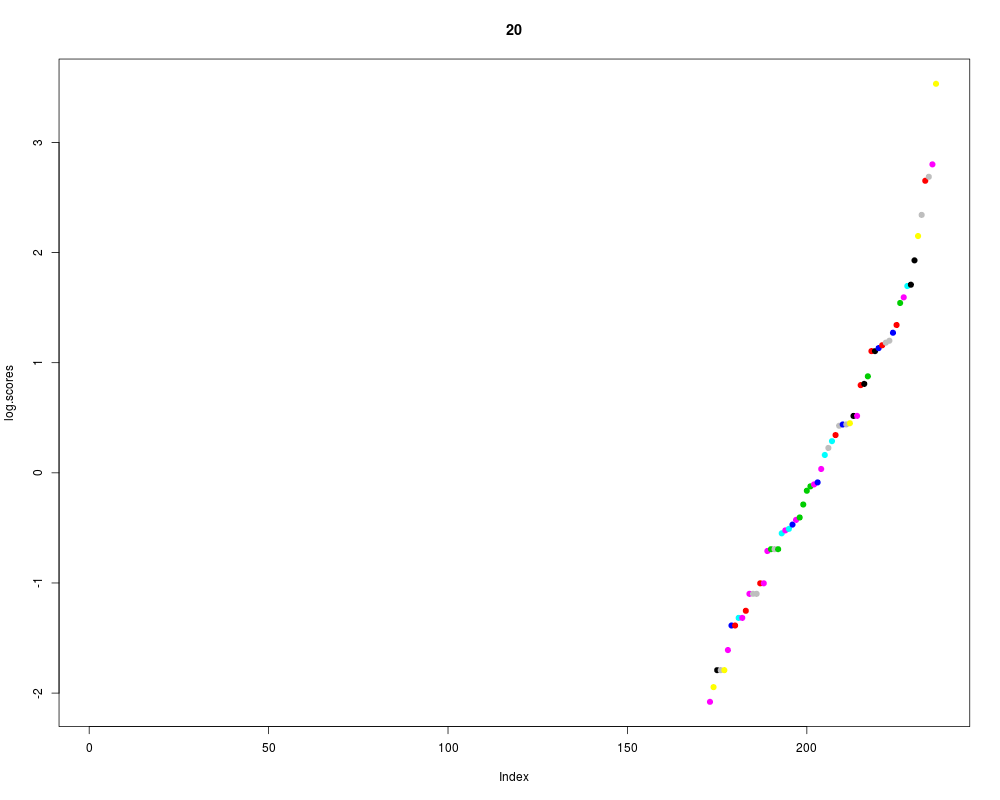
Computes the scores of the features.DescriptionSeveral random subsets are sampled from the input data and for each random subset, various linear models are fitted using lars method. A score is assigned to each feature based on the tendency of LASSO in including that feature in the models. Finally, the average score and the models are returned as the output. UsageFeaLect(F, L, maximum.features.num = dim(F)[2], total.num.of.models, gamma = 3/4, persistence = 1000, talk = FALSE, minimum.class.size = 2, report.fitting.failure = FALSE, return_linear.models = TRUE, balance = TRUE, replace = TRUE, plot.scores = TRUE) Arguments
DetailsSee the reference for more details. ValueReturns a list of:
NoteLogistic regression is also done on top of fitting the linear models. Author(s)Habil Zare References"Statistical Analysis of Overfitting Features", manuscript in preparation. See Also
Exampleslibrary(FeaLect) data(mcl_sll) F <- as.matrix(mcl_sll[ ,-1]) # The Feature matrix L <- as.numeric(mcl_sll[ ,1]) # The labels names(L) <- rownames(F) message(dim(F)[1], " samples and ",dim(F)[2], " features.") ## For this data, total.num.of.models is suggested to be at least 100. FeaLect.result <-FeaLect(F=F,L=L,maximum.features.num=10,total.num.of.models=20,talk=TRUE) Results
R version 3.3.1 (2016-06-21) -- "Bug in Your Hair"
Copyright (C) 2016 The R Foundation for Statistical Computing
Platform: x86_64-pc-linux-gnu (64-bit)

R is free software and comes with ABSOLUTELY NO WARRANTY.
You are welcome to redistribute it under certain conditions.
Type 'license()' or 'licence()' for distribution details.

R is a collaborative project with many contributors.
Type 'contributors()' for more information and
'citation()' on how to cite R or R packages in publications.

Type 'demo()' for some demos, 'help()' for on-line help, or
'help.start()' for an HTML browser interface to help.
Type 'q()' to quit R.

> library(FeaLect)
Loading required package: lars
Loaded lars 1.2

Loading required package: rms
Loading required package: Hmisc
Loading required package: lattice
Loading required package: survival
Loading required package: Formula
Loading required package: ggplot2

Attaching package: 'Hmisc'

The following objects are masked from 'package:base':

    format.pval, round.POSIXt, trunc.POSIXt, units

Loading required package: SparseM

Attaching package: 'SparseM'

The following object is masked from 'package:base':

    backsolve

> png(filename="/home/ddbj/snapshot/RGM3/R_CC/result/FeaLect/FeaLect.Rd_%03d_medium.png", width=480, height=480)
> ### Name: FeaLect
> ### Title: Computes the scores of the features.
> ### Aliases: FeaLect
> ### Keywords: regression multivariate classif models
>
> ### ** Examples
>
> library(FeaLect)
> data(mcl_sll)
> F <- as.matrix(mcl_sll[ ,-1])	# The Feature matrix
> L <- as.numeric(mcl_sll[ ,1])	# The labels
> names(L) <- rownames(F)
> message(dim(F)[1], " samples and ",dim(F)[2], " features.")
22 samples and 236 features.
>
> ## For this data, total.num.of.models is suggested to be at least 100.
> FeaLect.result <-FeaLect(F=F,L=L,maximum.features.num=10,total.num.of.models=20,talk=TRUE)
***********************************************
Scoring 236 features using 22 samples.
 - started at: 2016-07-04 18:03:40
 - sampling.index: 1
 - sampling.index: 2
----------------again
 - sampling.index: 2
 - sampling.index: 3
 - sampling.index: 4
----------------again
 - sampling.index: 4
 - sampling.index: 5
----------------again
 - sampling.index: 5
----------------again
 - sampling.index: 5
 - sampling.index: 6
 - sampling.index: 7
 - sampling.index: 8
----------------again
 - sampling.index: 8
singular information matrix in lrm.fit (rank= 1 ).  Offending variable(s):
linear.scores
----------------again
 - sampling.index: 8
----------------again
 - sampling.index: 8
----------------again
 - sampling.index: 8
 - sampling.index: 9
----------------again
 - sampling.index: 9
 - sampling.index: 10
----------------again
 - sampling.index: 10
 - sampling.index: 11
----------------again
 - sampling.index: 11
 - sampling.index: 12
 - sampling.index: 13
----------------again
 - sampling.index: 13
----------------again
 - sampling.index: 13
 - sampling.index: 14
 - sampling.index: 15
----------------again
 - sampling.index: 15
 - sampling.index: 16
 - sampling.index: 17
 - sampling.index: 18
----------------again
 - sampling.index: 18
----------------again
 - sampling.index: 18
----------------again
 - sampling.index: 18
 - sampling.index: 19
----------------again
 - sampling.index: 19
 - sampling.index: 20
****************************************************
validation ended at: 2016-07-04 18:03:41   taking:   1.5087571144104
****************************************************
>
>
>
>
>
>
> dev.off()
null device
          1
>
|