Supported by Dr. Osamu Ogasawara and  . . |
|
Last data update: 2014.03.03 |
Prepare Hi-C calibrationDescriptionA function to build a calibration function, by fitting a subset of FISH distances and Hi-C frequencies with a power law model (see details). The number of distances to fit (taking distances by increasing order) or a subset of selected distances should be provided by the user. Users can also choose how to estimate the distance threshold or may explicitly provide one. UsageprepareCalib(data, npoints, threshold = NULL, useMax = TRUE, delta = 0.05, buffer = 1.0) Arguments
DetailsWe use a power law model to relate a set of FISH distances, D, and a matching set of contact frequencies, C:
C ~ βD^α ValueA list with the following objects:
Author(s)Yoli Shavit ReferencesY. Shavit, F.K. Hamey, P. Lio', FisHiCal: an R package for iterative FISH-based calibration of Hi-C data, 2014 (submitted). See Also
Examples
data(match)
npoints = 10 # number of points to fit
# prepareCalib computes threshold according to the fit
# useMax is set to FALSE
res = prepareCalib(match, npoints, useMax = FALSE)
calib = res$calib
calib
fit = res$fit
alpha = calib$params[[1]]
beta = calib$params[[2]]
threshold = calib$params[[3]]
# plot
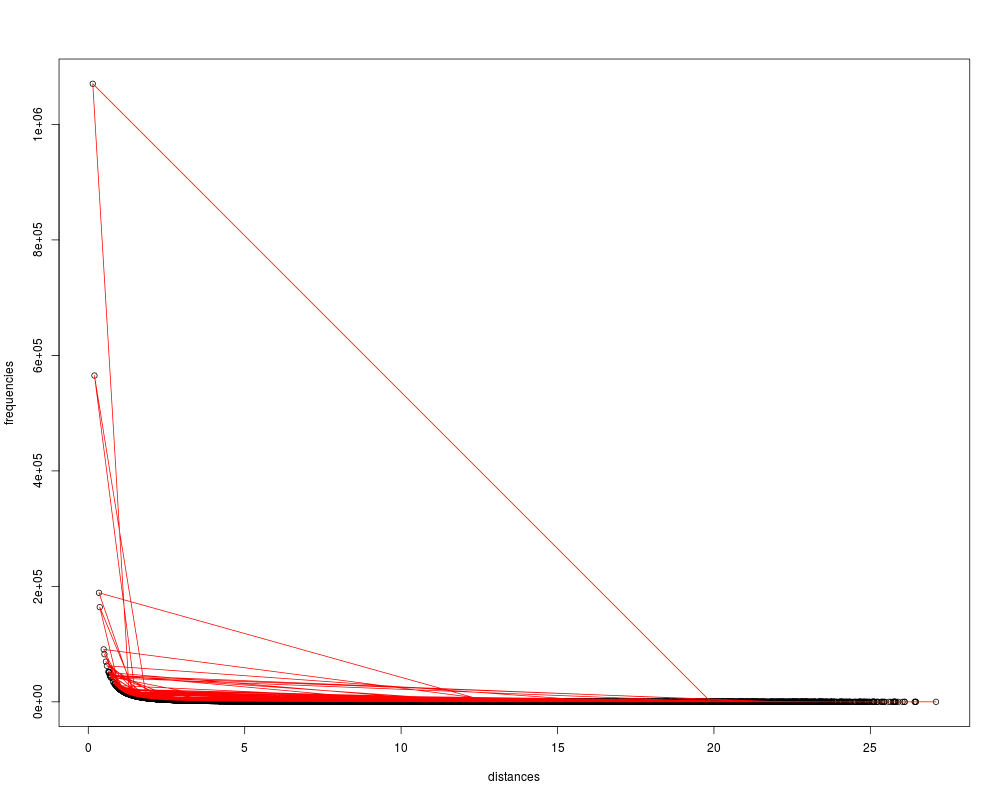
plot(match$frequencies ~ match$distances, xlab = "distances",
ylab = "frequencies")
lines((exp(beta)*match$distances^alpha)~match$distances,
col = "red")
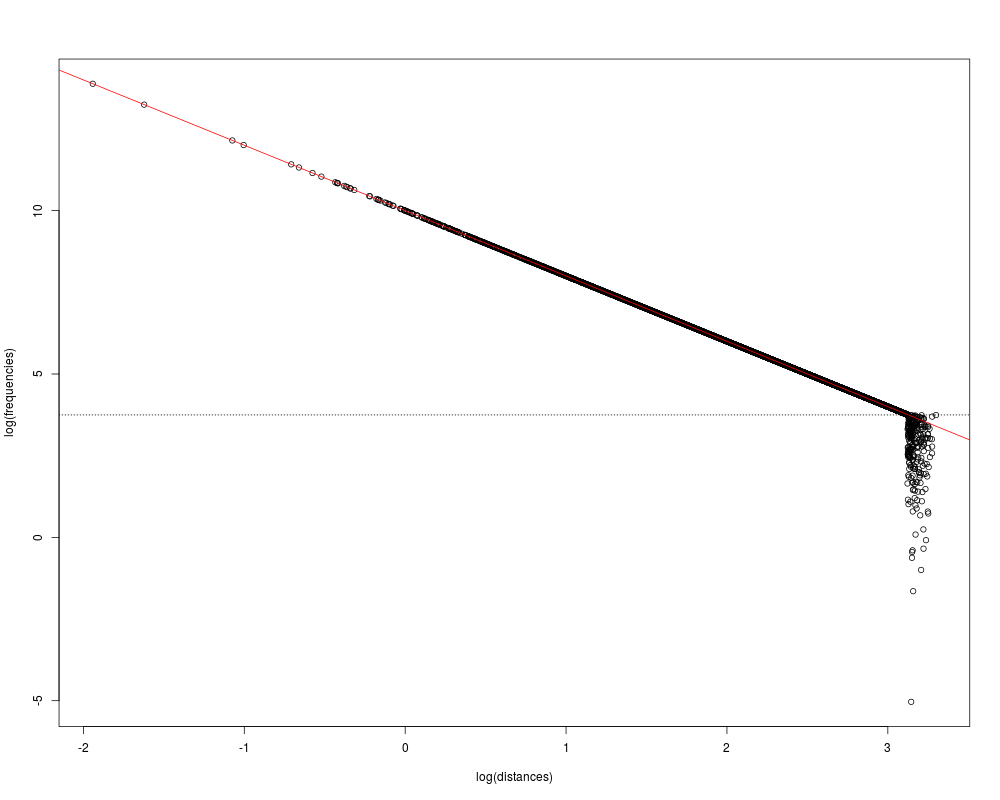
plot(log(match$frequencies) ~ log(match$distances),
xlab = "log(distances)", ylab = "log(frequencies)")
abline(fit, col = "red")
# plot the estimated threshold
abline(h = beta + log(threshold)*alpha, lty = 3)
Results
R version 3.3.1 (2016-06-21) -- "Bug in Your Hair"
Copyright (C) 2016 The R Foundation for Statistical Computing
Platform: x86_64-pc-linux-gnu (64-bit)

R is free software and comes with ABSOLUTELY NO WARRANTY.
You are welcome to redistribute it under certain conditions.
Type 'license()' or 'licence()' for distribution details.

R is a collaborative project with many contributors.
Type 'contributors()' for more information and
'citation()' on how to cite R or R packages in publications.

Type 'demo()' for some demos, 'help()' for on-line help, or
'help.start()' for an HTML browser interface to help.
Type 'q()' to quit R.

> library(FisHiCal)
Loading required package: igraph

Attaching package: 'igraph'

The following objects are masked from 'package:stats':

    decompose, spectrum

The following object is masked from 'package:base':

    union

Loading required package: RcppArmadillo
> png(filename="/home/ddbj/snapshot/RGM3/R_CC/result/FisHiCal/prepareCalib.Rd_%03d_medium.png", width=480, height=480)
> ### Name: prepareCalib
> ### Title: Prepare Hi-C calibration
> ### Aliases: prepareCalib
>
> ### ** Examples
>
>  data(match)
>  npoints = 10 # number of points to fit
>
>  # prepareCalib computes threshold according to the fit
>  # useMax is set to FALSE
>  res = prepareCalib(match, npoints, useMax = FALSE)
>  calib = res$calib
>  calib
$f
function (m, params)
{
    a = params[[1]]
    b = params[[2]]
    threshold = params[[3]]
    m = exp((log(m) - b)/a)
    m[m == Inf] = 0
    m[m > threshold] = 0
    return(m)
}
<environment: 0x2325988>

$params
$params[[1]]
[1] -2

$params[[2]]
[1] 10

$params[[3]]
[1] 22.79646


>  fit = res$fit
>  alpha = calib$params[[1]]
>  beta = calib$params[[2]]
>  threshold = calib$params[[3]]
>
>  # plot
>  plot(match$frequencies ~ match$distances, xlab = "distances",
+  ylab = "frequencies")
>
>  lines((exp(beta)*match$distances^alpha)~match$distances,
+  col = "red")
>
>  plot(log(match$frequencies) ~ log(match$distances),
+  xlab = "log(distances)", ylab = "log(frequencies)")
>  abline(fit, col = "red")
>
>  # plot the estimated threshold
>  abline(h = beta + log(threshold)*alpha, lty = 3)
>
>
>
>
>
>
> dev.off()
null device
          1
>
|