Supported by Dr. Osamu Ogasawara and  . . |
|
Last data update: 2014.03.03 |
Theoretical Autocovariance Function of ARDescriptionThe theoretical autocovariance function of an AR(p) with unit variance is computed. This algorithm has many applications. In this package it is used for the computation of the information matrix, in simulating p initial starting values for AR simulations and in the computation of the exact mle for the mean. UsageTacvfAR(phi, lag.max = 20) Arguments
DetailsThe algorithm given by McLeod (1975) is used. The built-in R function ARMAacf could also be used but it is quite complicated and apart from the source code, the precise algorithm used is not described. The only reference given for ARMAacf is the Brockwell and Davis (1991) but this text does not give any detailed exact algorithm for the general case. Another advantage of TacvfAR over ARMAacf is that it will be easier for to translate and implement this algorithm in other computing environments such as MatLab etc. since the code is entirely written in R. ValueVector of length = (lag.max+1) containing the autocovariances at lags 0,...,lag.max is returned. Author(s)A.I. McLeod ReferencesMcLeod, A.I. (1975), Derivation of the theoretical autocorrelation function of autoregressive moving-average time series. Applied Statistics, 24, 255-256. See Also
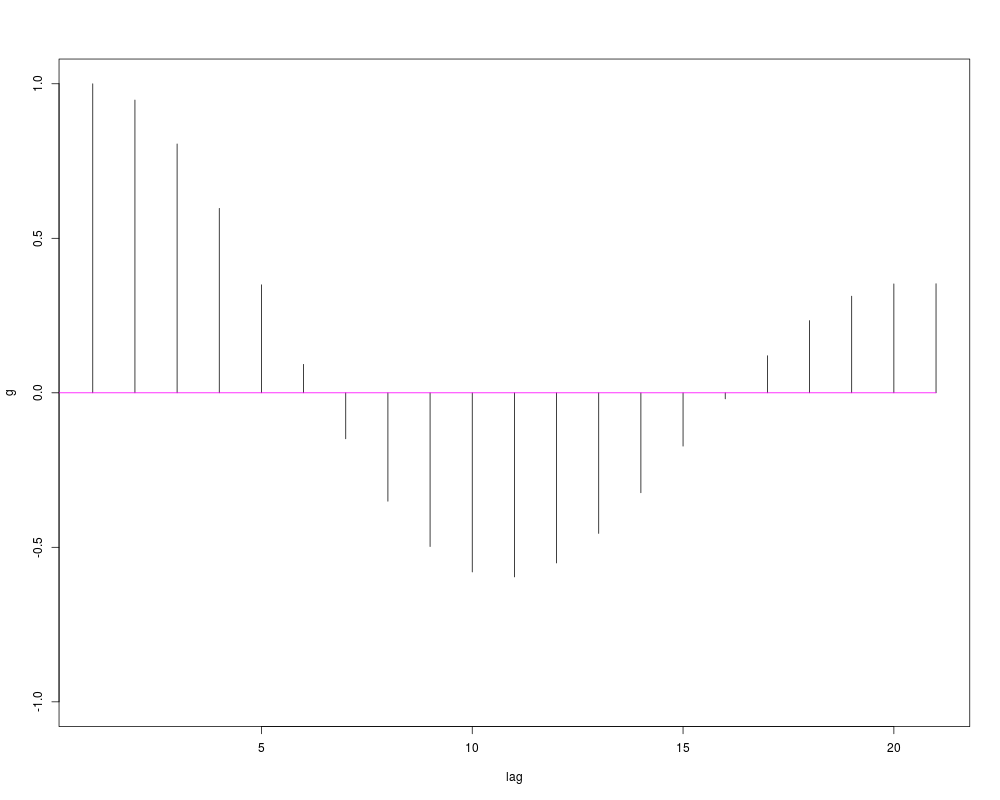
Examples#calculate and plot the autocorrelations from an AR(2) model # with parameter vector c(1.8,-0.9). g<-TacvfAR(c(1.8,-0.9),20) AcfPlot(g/g[1], LagZeroQ=FALSE) Results
R version 3.3.1 (2016-06-21) -- "Bug in Your Hair"
Copyright (C) 2016 The R Foundation for Statistical Computing
Platform: x86_64-pc-linux-gnu (64-bit)

R is free software and comes with ABSOLUTELY NO WARRANTY.
You are welcome to redistribute it under certain conditions.
Type 'license()' or 'licence()' for distribution details.

R is a collaborative project with many contributors.
Type 'contributors()' for more information and
'citation()' on how to cite R or R packages in publications.

Type 'demo()' for some demos, 'help()' for on-line help, or
'help.start()' for an HTML browser interface to help.
Type 'q()' to quit R.

> library(FitAR)
Loading required package: lattice
Loading required package: leaps
Loading required package: ltsa
Loading required package: bestglm
> png(filename="/home/ddbj/snapshot/RGM3/R_CC/result/FitAR/TacvfAR.Rd_%03d_medium.png", width=480, height=480)
> ### Name: TacvfAR
> ### Title: Theoretical Autocovariance Function of AR
> ### Aliases: TacvfAR
> ### Keywords: ts
>
> ### ** Examples
>
> #calculate and plot the autocorrelations from an AR(2) model
> # with parameter vector c(1.8,-0.9).
>  g<-TacvfAR(c(1.8,-0.9),20)
>  AcfPlot(g/g[1], LagZeroQ=FALSE)
>
>
>
>
>
>
> dev.off()
null device
          1
>
|