Supported by Dr. Osamu Ogasawara and  . . |
|
Last data update: 2014.03.03 |
auto.shadingDescriptionCreates an object of class Usageauto.shading(x, digits = 2, cutter = quantileCuts, n = 5, params = NA, cols = brewer.pal(n, "Reds")) Arguments
DetailsReturns an object of class ValueAn object of class
Author(s)Chris Brunsdon See Also
Examples
# Read in map data and compute a rate for mapping
sids <- readShapePoly(system.file("shapes/sids.shp", package="maptools")[1],
proj4string=CRS("+proj=longlat +ellps=clrk66"))
sids.rate=10000*sids$SID74/sids$BIR74
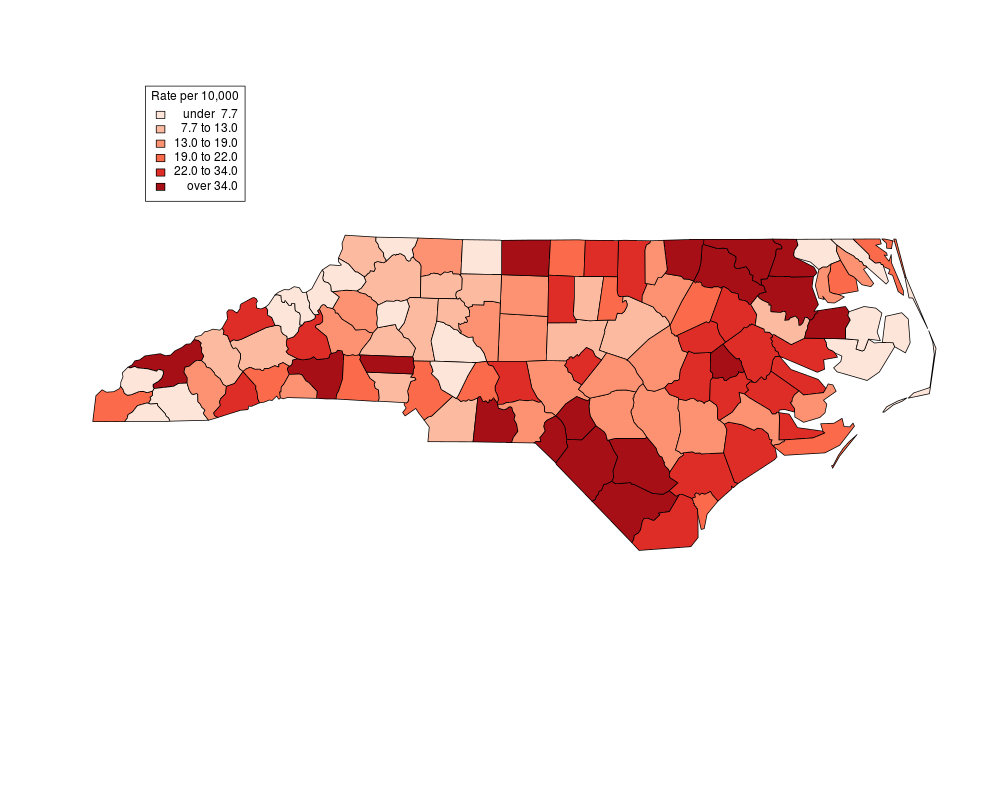
# Create the shading scheme, plot a choropleth map and add a legend
shades = auto.shading(sids.rate,n=6)
choropleth(sids,sids.rate,shades)
choro.legend(-83.77,37.87,shades,fmt="%4.1f",title='Rate per 10,000')
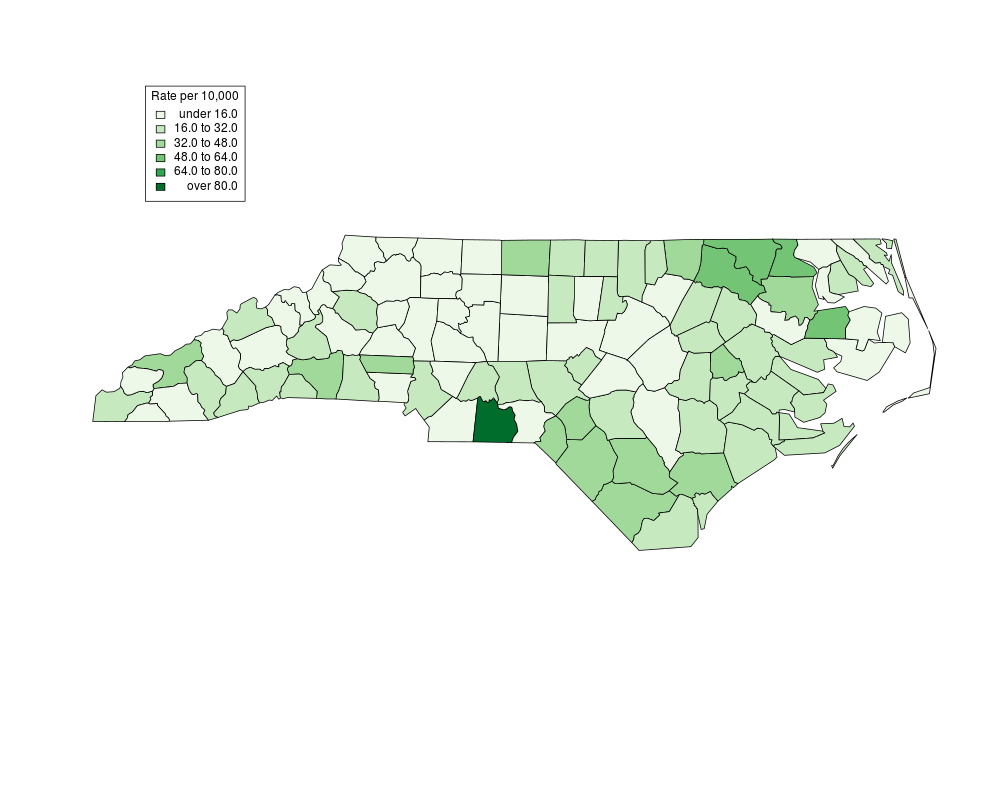
# Now again with a different set of class intervals and colours
shades = auto.shading(sids.rate,n=6,cutter=rangeCuts,cols=brewer.pal(6,'Greens'))
choropleth(sids,sids.rate,shades)
choro.legend(-83.77,37.87,shades,fmt="%4.1f",title='Rate per 10,000')
Results
R version 3.3.1 (2016-06-21) -- "Bug in Your Hair"
Copyright (C) 2016 The R Foundation for Statistical Computing
Platform: x86_64-pc-linux-gnu (64-bit)

R is free software and comes with ABSOLUTELY NO WARRANTY.
You are welcome to redistribute it under certain conditions.
Type 'license()' or 'licence()' for distribution details.

R is a collaborative project with many contributors.
Type 'contributors()' for more information and
'citation()' on how to cite R or R packages in publications.

Type 'demo()' for some demos, 'help()' for on-line help, or
'help.start()' for an HTML browser interface to help.
Type 'q()' to quit R.

> library(GISTools)
Loading required package: maptools
Loading required package: sp
Checking rgeos availability: TRUE
Loading required package: RColorBrewer
Loading required package: MASS
Loading required package: rgeos
rgeos version: 0.3-19, (SVN revision 524)
 GEOS runtime version: 3.5.0-CAPI-1.9.0 r4084
 Linking to sp version: 1.2-3
 Polygon checking: TRUE

> png(filename="/home/ddbj/snapshot/RGM3/R_CC/result/GISTools/auto.shading.Rd_%03d_medium.png", width=480, height=480)
> ### Name: auto.shading
> ### Title: auto.shading
> ### Aliases: auto.shading
>
> ### ** Examples
>
> # Read in map data and compute a rate for mapping
> sids <- readShapePoly(system.file("shapes/sids.shp", package="maptools")[1],
+ 	proj4string=CRS("+proj=longlat +ellps=clrk66"))
> sids.rate=10000*sids$SID74/sids$BIR74
> # Create the shading scheme,  plot a choropleth map and add a legend
> shades = auto.shading(sids.rate,n=6)
> choropleth(sids,sids.rate,shades)
> choro.legend(-83.77,37.87,shades,fmt="%4.1f",title='Rate per 10,000')
> # Now again with a different set of class intervals and colours
> shades = auto.shading(sids.rate,n=6,cutter=rangeCuts,cols=brewer.pal(6,'Greens'))
> choropleth(sids,sids.rate,shades)
> choro.legend(-83.77,37.87,shades,fmt="%4.1f",title='Rate per 10,000')
>
>
>
>
>
> dev.off()
null device
          1
>
|