Supported by Dr. Osamu Ogasawara and  . . |
|
Last data update: 2014.03.03 |
Level plot for gridded dataDescriptionDraws a level plot given a SpatialPixelsDataFrame, an index and a shading scheme. Usagelevel.plot(grd, shades, index=1, add=FALSE) Arguments
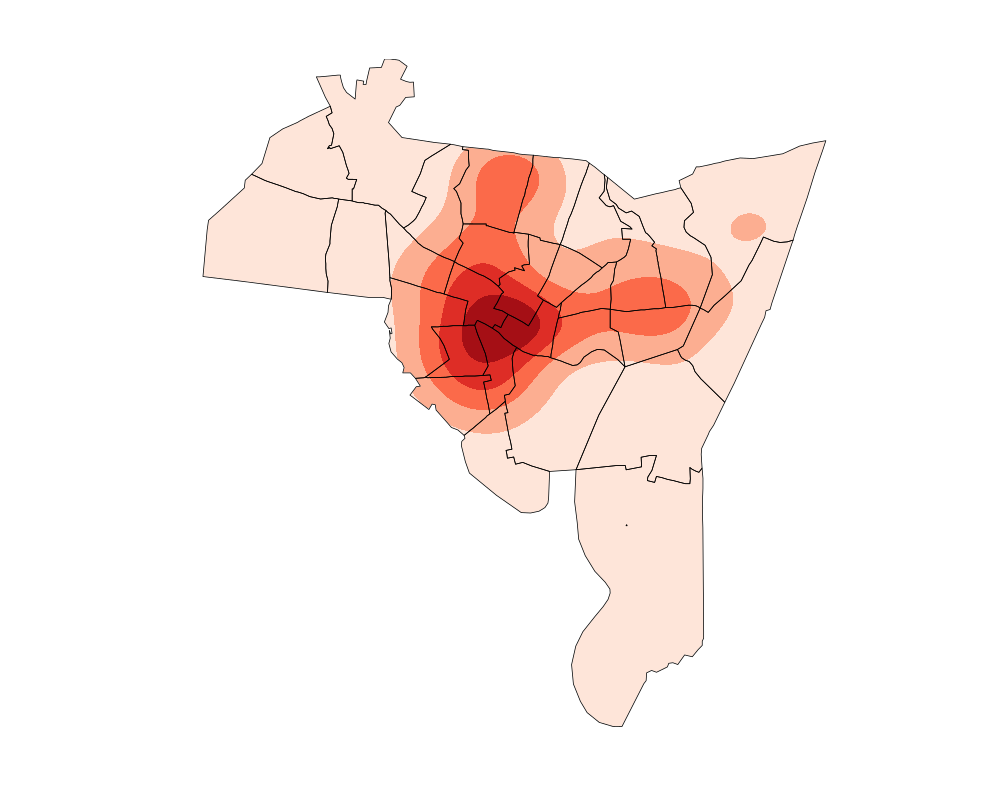
DetailsThe function returns no value, but draws a level plot on the current graphics device as a side effect. ValueNone (see above). Author(s)Chris Brunsdon Examples# Data for New Haven to use in example data(newhaven) # Do the KDE breach.dens = kde.points(breach,lims=tracts) # Plot the result level.plot(breach.dens) # Block out the part outside the study area masker = poly.outer(breach.dens,tracts,extend=100); add.masking(masker) # Plot census tract boundaries plot(tracts,add=TRUE) Results
R version 3.3.1 (2016-06-21) -- "Bug in Your Hair"
Copyright (C) 2016 The R Foundation for Statistical Computing
Platform: x86_64-pc-linux-gnu (64-bit)

R is free software and comes with ABSOLUTELY NO WARRANTY.
You are welcome to redistribute it under certain conditions.
Type 'license()' or 'licence()' for distribution details.

R is a collaborative project with many contributors.
Type 'contributors()' for more information and
'citation()' on how to cite R or R packages in publications.

Type 'demo()' for some demos, 'help()' for on-line help, or
'help.start()' for an HTML browser interface to help.
Type 'q()' to quit R.

> library(GISTools)
Loading required package: maptools
Loading required package: sp
Checking rgeos availability: TRUE
Loading required package: RColorBrewer
Loading required package: MASS
Loading required package: rgeos
rgeos version: 0.3-19, (SVN revision 524)
 GEOS runtime version: 3.5.0-CAPI-1.9.0 r4084
 Linking to sp version: 1.2-3
 Polygon checking: TRUE

> png(filename="/home/ddbj/snapshot/RGM3/R_CC/result/GISTools/level.plot.Rd_%03d_medium.png", width=480, height=480)
> ### Name: level.plot
> ### Title: Level plot for gridded data
> ### Aliases: level.plot
>
> ### ** Examples
>
> # Data for New Haven to use in example
> data(newhaven)
> # Do the KDE
> breach.dens = kde.points(breach,lims=tracts)
> # Plot the result
> level.plot(breach.dens)
> # Block out the part outside the study area
> masker = poly.outer(breach.dens,tracts,extend=100); add.masking(masker)
> # Plot census tract boundaries
> plot(tracts,add=TRUE)
>
>
>
>
>
> dev.off()
null device
          1
>
|
Created & Maintained by Osamu Ogasawara (osamu.ogasawara@gmail.com) and 