Supported by Dr. Osamu Ogasawara and  . . |
|
Last data update: 2014.03.03 |
ShadingDescriptionCreates an object of class Usageshading(breaks, cols = brewer.pal(length(breaks), "Reds")) Arguments
ValueAn object of class WarningAt the moment, the it is assumed that the number of shading colours is one more than the break points, but this is not checked. Author(s)Chris Brunsdon See Also
Examples
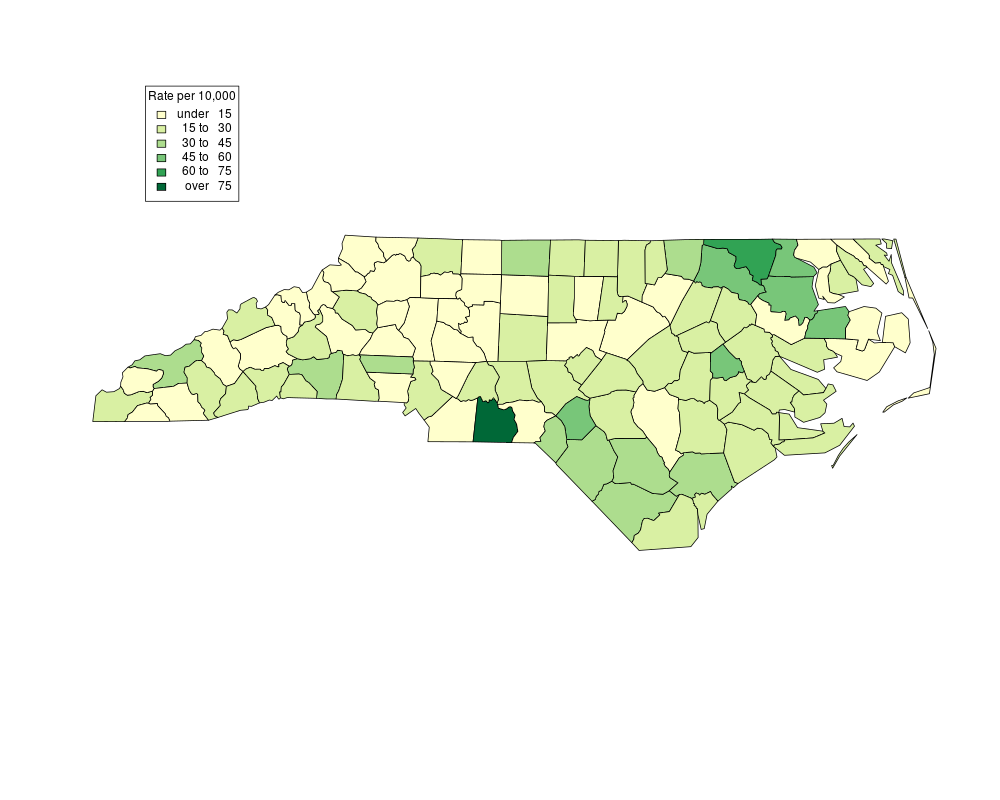
# Read in map data and compute a rate for mapping
sids <- readShapePoly(system.file("shapes/sids.shp", package="maptools")[1],
	proj4string=CRS("+proj=longlat +ellps=clrk66"))
sids.rate=10000*sids@data[,10]/sids@data[,9]
shades = shading(breaks=c(15,30,45,60,75),cols=brewer.pal(6,'YlGn'))
choropleth(sids,sids.rate,shades)
choro.legend(-83.77,37.87,shades,fmt="%4.0f",title='Rate per 10,000')
Results
R version 3.3.1 (2016-06-21) -- "Bug in Your Hair"
Copyright (C) 2016 The R Foundation for Statistical Computing
Platform: x86_64-pc-linux-gnu (64-bit)

R is free software and comes with ABSOLUTELY NO WARRANTY.
You are welcome to redistribute it under certain conditions.
Type 'license()' or 'licence()' for distribution details.

R is a collaborative project with many contributors.
Type 'contributors()' for more information and
'citation()' on how to cite R or R packages in publications.

Type 'demo()' for some demos, 'help()' for on-line help, or
'help.start()' for an HTML browser interface to help.
Type 'q()' to quit R.

> library(GISTools)
Loading required package: maptools
Loading required package: sp
Checking rgeos availability: TRUE
Loading required package: RColorBrewer
Loading required package: MASS
Loading required package: rgeos
rgeos version: 0.3-19, (SVN revision 524)
 GEOS runtime version: 3.5.0-CAPI-1.9.0 r4084
 Linking to sp version: 1.2-3
 Polygon checking: TRUE

> png(filename="/home/ddbj/snapshot/RGM3/R_CC/result/GISTools/shading.Rd_%03d_medium.png", width=480, height=480)
> ### Name: shading
> ### Title: Shading
> ### Aliases: shading
>
> ### ** Examples
>
> # Read in map data and compute a rate for mapping
> sids <- readShapePoly(system.file("shapes/sids.shp", package="maptools")[1],
+ 	proj4string=CRS("+proj=longlat +ellps=clrk66"))
> sids.rate=10000*sids@data[,10]/sids@data[,9]
> shades = shading(breaks=c(15,30,45,60,75),cols=brewer.pal(6,'YlGn'))
> choropleth(sids,sids.rate,shades)
> choro.legend(-83.77,37.87,shades,fmt="%4.0f",title='Rate per 10,000')
>
>
>
>
>
> dev.off()
null device
          1
>
|
Created & Maintained by Osamu Ogasawara (osamu.ogasawara@gmail.com) and 