Supported by Dr. Osamu Ogasawara and  . . |
|
Last data update: 2014.03.03 |
US Tornado Touchdown DataDescriptionData set from NOAA's National Weather Service Indianapolis, IN Weather Forecast Office 6900 W. Hanna Ave. Usagedata(tornados) torn torn2 Format
Source
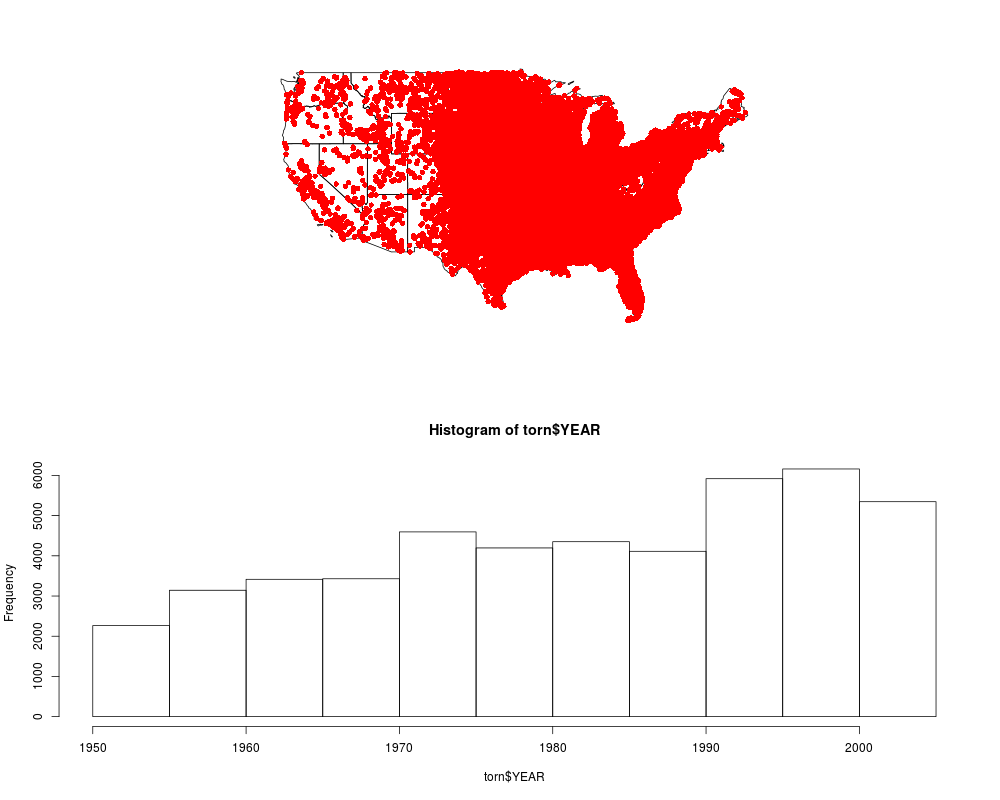
Examples# Read in the data data(tornados) # Split the plot in two par(mfrow=c(2,1)) # Plot US states plot(us_states) # Add Locations of observation stations plot(torn,add=TRUE,pch=16,col='red') # Plot a histogram of year of observation next to this hist(torn$YEAR) Results
R version 3.3.1 (2016-06-21) -- "Bug in Your Hair"
Copyright (C) 2016 The R Foundation for Statistical Computing
Platform: x86_64-pc-linux-gnu (64-bit)

R is free software and comes with ABSOLUTELY NO WARRANTY.
You are welcome to redistribute it under certain conditions.
Type 'license()' or 'licence()' for distribution details.

R is a collaborative project with many contributors.
Type 'contributors()' for more information and
'citation()' on how to cite R or R packages in publications.

Type 'demo()' for some demos, 'help()' for on-line help, or
'help.start()' for an HTML browser interface to help.
Type 'q()' to quit R.

> library(GISTools)
Loading required package: maptools
Loading required package: sp
Checking rgeos availability: TRUE
Loading required package: RColorBrewer
Loading required package: MASS
Loading required package: rgeos
rgeos version: 0.3-19, (SVN revision 524)
 GEOS runtime version: 3.5.0-CAPI-1.9.0 r4084
 Linking to sp version: 1.2-3
 Polygon checking: TRUE

> png(filename="/home/ddbj/snapshot/RGM3/R_CC/result/GISTools/tornados.Rd_%03d_medium.png", width=480, height=480)
> ### Name: tornados
> ### Title: US Tornado Touchdown Data
> ### Aliases: tornados torn torn2
>
> ### ** Examples
>
> # Read in the data
> data(tornados)
> # Split the plot in two
> par(mfrow=c(2,1))
> # Plot US states
> plot(us_states)
> # Add Locations of observation stations
> plot(torn,add=TRUE,pch=16,col='red')
> # Plot a histogram of year of observation next to this
> hist(torn$YEAR)
>
>
>
>
>
> dev.off()
null device
          1
>
|
Created & Maintained by Osamu Ogasawara (osamu.ogasawara@gmail.com) and 